Cosmos Price Prediction September 2026: ATOM Eyes $4 Breakout


Cosmos launched its interoperability-first blockchain vision back in 2019, positioning ATOM as the token securing the Cosmos Hub while dozens of independent chains connect through it via IBC.
Unlike a lot of infrastructure tokens, ATOM has no fixed max supply, so any long-term thesis has to lean on network usage and token burns rather than scarcity alone.
$ATOM currently sits at $1.53, down 2.7% on the day.
Anyone running a Cosmos price prediction September 2026 search right now wants to know whether the multi-month descending channel on the weekly chart is finally about to break or whether this is just another lower high inside it.
Price Today: Live Data and 24-Hour Change
Metric | Value |
Price | $1.53 |
24H Change | -2.7% |
24H Range | $1.51 - $1.58 |
Market Cap | $807.229M |
Fully Diluted Valuation | $807.236M |
24H Trading Volume | $42.467M |
Circulating Supply | 526.962M |
Total Supply | 526.97M |
Max Supply | ∞ |
Source: Market data taken from chart and market snapshots, data as of Aug 25, 2026. Figures may vary slightly across other tracking websites.
Key Takeaways
ATOM trades at $1.53, down 2.7% on the day, after a weekly candle that opened at $1.603 and closed at $1.533, down 4.31% for the week.
The weekly chart shows ATOM still inside a descending channel that's been in place for months, with the price currently sitting near the lower half of that channel.
A break above the channel's upper boundary on rising volume opens a path toward $2.715, then $3.256, and $4.131 further out.
A rejection from the upper boundary keeps ATOM inside the channel, with $1.257 and $0.942 as the next support levels if the floor gives way.
A market cap of $807.229M against an uncapped max supply means any bullish long-term case depends more on real network usage and token burns than on scarcity.
Technical Analysis: Weekly Descending Channel
$ATOM has been trading inside a descending channel on the weekly chart, with lower highs and lower lows defining both boundaries since the downtrend began.
The price is currently sitting closer to the lower half of that channel after a red weekly candle.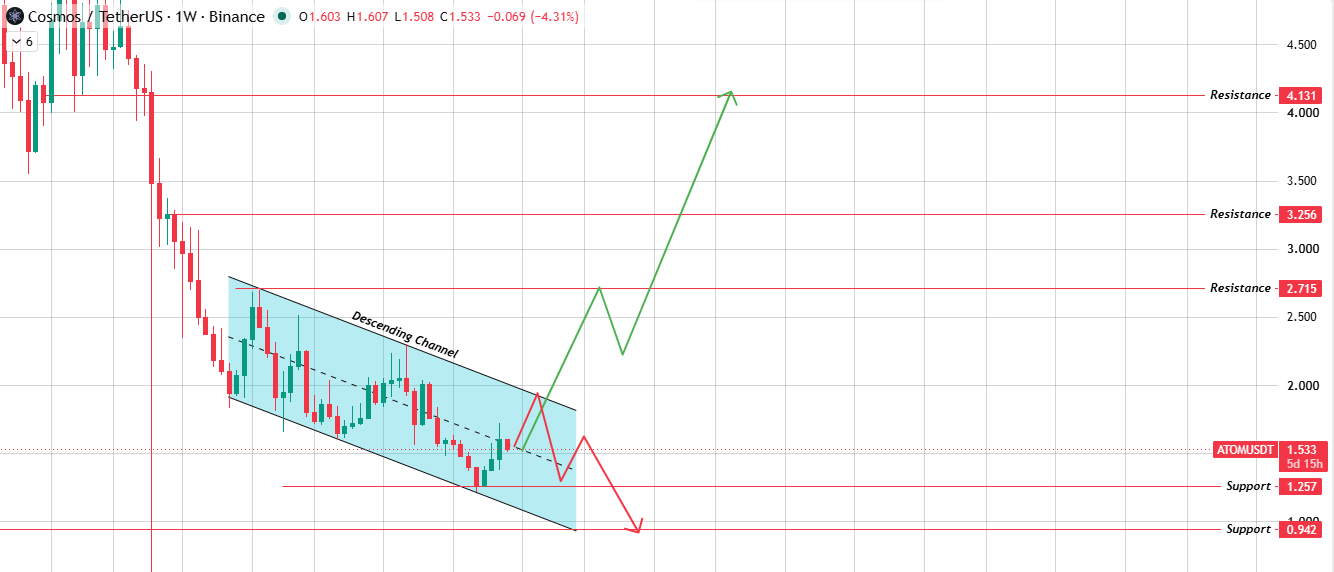
Source: Chart Taken From TradingView.
The setup here is straightforward: if the price pushes up and breaks the channel's upper boundary with volume behind it, $ATOM has room to run toward $2.715, then $3.256, and eventually $4.131.
If instead the price gets rejected from that upper boundary, the more likely path is a drift back down toward lower levels inside or below the channel.
That distinction is the whole story for September. A breakout attempt that fails at the upper boundary on weak volume tends to just become another lower high inside the same channel, while a volume-backed break is what actually ends the downtrend structure.
Technical Analysis: Key Support and Resistance
Level Type | Price |
Resistance 3 | $4.131 |
Resistance 2 | $3.256 |
Resistance 1 | $2.715 |
Support 1 | $1.257 |
Support 2 | $0.942 |
Cosmos Price Prediction September 2026: Bull, Base, and Bear Cases
Scenario | Level | Setup | Invalidation |
Bull | $2.715 - $4.131 | ATOM breaks above the descending channel's upper boundary on rising volume, holds the breakout on a retest, and pushes through $2.715, then $3.256, toward $4.131. | Weekly close back inside the channel after the breakout |
Base | $1.257 - $2.715 | ATOM keeps testing the upper boundary without a decisive break, chopping between it and the mid-channel zone while volume stays light. | Extended consolidation without a confirmed break of either boundary |
Bear | $1.257 - $0.942 | ATOM gets rejected from the channel's upper boundary again, the downtrend structure holds, and price grinds down toward $1.257 and then $0.942. | Reclaim and hold above the channel's upper boundary |
On-Chain and Fundamental Drivers
ATOM's market cap of $807.229M sits against a circulating supply of 526.962M tokens, with no hard max supply cap, which puts more weight on actual usage of the Cosmos Hub and the wider IBC ecosystem than on any fixed scarcity narrative.
Daily trading volume of $42.467M relative to market cap suggests moderate liquidity, enough to support a genuine breakout move but thin enough that a sudden volume spike, in either direction, can move price quickly.
Token burns tied to Cosmos Hub fee mechanisms are the closest thing ATOM has to a supply-side offset, and their pace matters more here than it would for a fixed-supply asset.
September Catalysts That Could Move the Price
Continued growth in IBC-connected chains and total value transferred across the Cosmos ecosystem is one lever worth tracking, since that activity feeds directly into Hub fee revenue and burns.
Broader altcoin risk appetite matters a lot for a token like $ATOM, which tends to move with the wider market's willingness to rotate into mid-cap infrastructure plays rather than trading purely on its own news.
Any governance proposals around Cosmos Hub tokenomics, staking rewards, or new chain launches secured by the Hub are also worth watching heading into September.
None of this guarantees a move; these are simply the factors worth tracking alongside the chart.
What Analysts Are Forecasting
Price level estimates for ATOM vary widely depending on the source, and there isn't strong agreement on a single September number across trackers.
The more reliable approach is to treat the technical levels above as the actual forecast: the descending channel's upper boundary is the level bulls need to clear with volume, and $1.257 is the level bears need to break for the downtrend to extend. Everything else follows from whichever side wins that test.
Long-Term Outlook: 2027 to 2030
Zooming out past September, ATOM's trajectory depends heavily on whether Cosmos keeps its position as the interoperability layer of choice as more chains launch and compete for that role.
A confirmed break of the weekly descending channel, followed by a sustained run through $2.715, $3.256, and $4.131 over the following quarters, is the technical path that would support a genuinely bullish multi-year story.
Without a fixed supply cap, that story leans more on adoption and fee burns compounding over time than on scarcity doing the work by itself.
Risks That Could Invalidate This Forecast
This entire technical picture rests on how $ATOM behaves at the descending channel's upper boundary.
A rejection there, especially on declining volume, keeps the multi-month downtrend intact and points back toward $1.257 first, then $0.942.
Beyond the chart, a broad altcoin market downturn, slower-than-expected IBC ecosystem growth, or a shift in staking incentives away from the Hub would all weigh on this setup regardless of where price sits technically.
How to Buy and Store It Safely
$ATOM trades on most major centralized exchanges and can also be acquired through decentralized exchanges within the Cosmos ecosystem itself.
Stick to platforms with deep order books, since thinner liquidity spots see wider slippage during volatile weekly candles.
For storage, small amounts are fine on an exchange, but larger holdings belong on a hardware wallet or a native Cosmos wallet like Keplr.
If $ATOM is being staked to a validator, it's worth understanding validator risk and unbonding periods, separate from the price risk of holding the token.
Glossary
Descending channel: Two parallel falling trendlines bounding the price until it breaks one side.
Resistance: A level where selling has historically capped price.
Support: A level where buying has historically stepped in.
Breakout: A decisive close beyond a trendline or channel boundary.
IBC: The Inter-Blockchain Communication protocol that lets independent Cosmos chains transfer assets and data between each other.
Methodology
This Cosmos price prediction September 2026 piece is built from weekly chart structure, live market data, and standard technical tools, including channel analysis. Every scenario includes a clear invalidation level so readers can track whether the thesis still holds as new candles print.
Disclaimer: This article is for informational purposes only and does not constitute financial advice. Cryptocurrency markets are highly volatile, and prices can move sharply in either direction without warning. Always do independent research and consult a licensed financial advisor before making investment decisions.

















