TRON Price Prediction September 2026: TRX Eyes a Major Breakout


TRX has been climbing steadily along a trendline that's held up for months, and the chart just closed another bullish weekly candle to confirm it.
Traders who've been riding this slow, grinding uptrend are now watching to see if the next leg finally clears old resistance, and this TRON price prediction September 2026 breaks down exactly what that would take.
Corporate accumulation is also adding a fresh layer of demand to a setup that's already been quietly working.
TRX Price Today: Live Data and 24-Hour Change
TRX is trading near $0.34240 on the 1W chart. Separate live data from CoinGlass puts the coin around $0.34241, down roughly 0.4% over the past 24 hours, with futures volume of $175.42 million against spot volume of $52.36 million and open interest at $271.70 million.
Market cap stands at $32.49 billion on a circulating supply of 94.91 billion TRX, matching its total supply, with no max supply cap set on the token.
Source: TradingView (TRX/USDT perpetual, Binance, weekly chart) and CoinGlass, both accessed August 25, 2026, IST.
TRON News: Tron Inc. Expands Its Treasury
Crypto.news reported roughly 14 hours before this piece that Tron Inc. acquired 145,002 TRX at an average price of $0.3448, pushing the company's treasury past 711.2 million TRX tokens.
Corporate treasury purchases like this add a steady source of demand outside of retail trading activity, and a treasury of this size gives Tron Inc. a meaningful stake in how the token performs going forward.
Source: X post by @cryptodotnews, posted roughly 14 hours before this piece, August 25, 2026.
TRX Liquidation Data Today
Long-side liquidations have outweighed short-side liquidations across every measured window.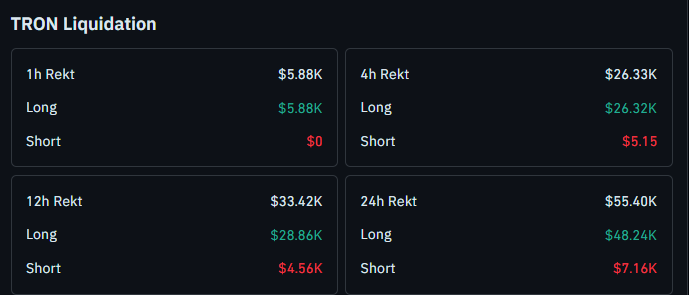
Over 24 hours, long-side liquidations totaled $48.24K against just $7.16K on the short side, and over 12 hours it was $28.86K long-side versus $4.56K short-side.
That pattern suggests some leveraged longs have been getting shaken out on pullbacks even as the broader trend stays intact.
Source: CoinGlass liquidation data, August 25, 2026.
Quick Take
CMP: $0.34240
Weekly trigger: close above $0.37730, opens $0.45089, then $0.50000
Weekly failure: close below $0.30846 invalidates the bullish structure
Data as of August 25, 2026, IST
Short risk note: these levels come from the weekly chart and depend on confirmed weekly closes, not intraday wicks.
Leveraged positions around these zones carry liquidation risk if price whipsaws before a level is confirmed.
TRON Technical Forecast September 2026
TRX has been taking support from a long ascending trendline for months, using it as a floor through multiple pullbacks without ever losing the broader uptrend.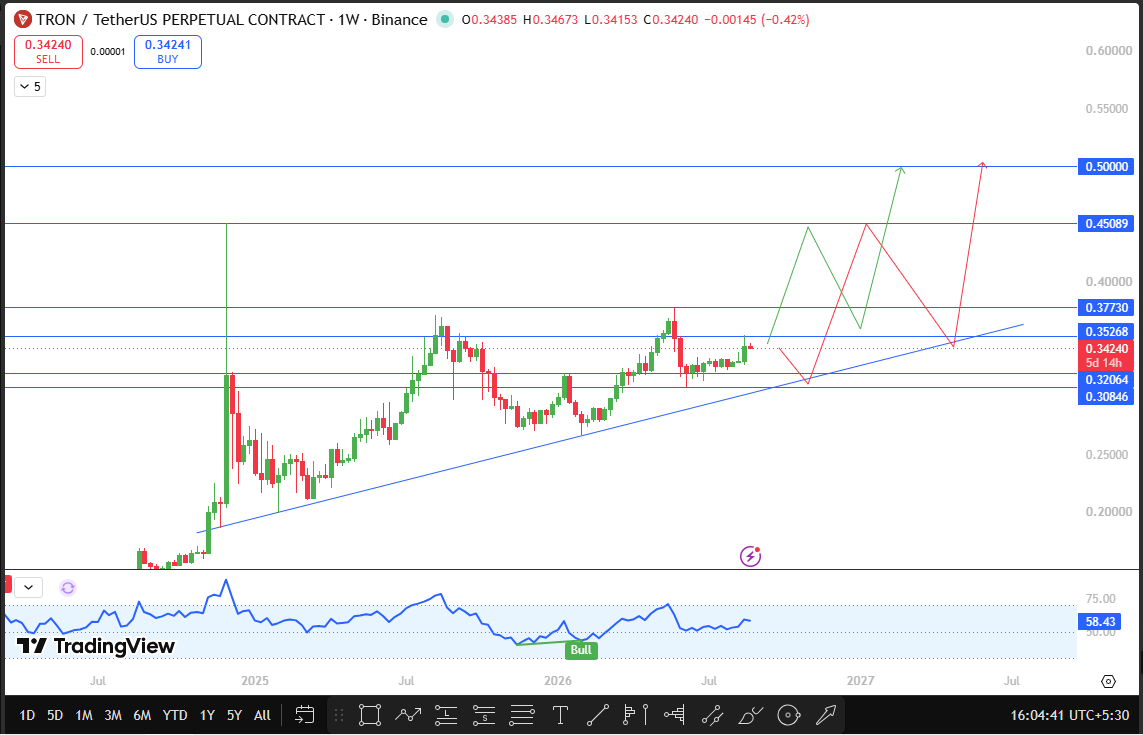
The most recent weekly candle closed bullish, continuing that pattern of higher lows building along the trendline.
If TRX breaks and closes a weekly candle above $0.37730, it opens the door to $0.45089 as the next resistance.
Beyond that, $0.50 stands out as the next major level, a round psychological number that tends to attract both profit-taking and fresh buying interest.
On the downside, a weekly close below $0.30846 would invalidate this bullish structure entirely, suggesting the ascending trendline has finally failed to hold as support.
Source: TradingView, TRX/USDT perpetual chart, 1-week timeframe, Binance, captured August 25, 2026, IST.
TRX Support and Resistance Levels to Watch
Level Type | Price | Note |
Support | $0.30846 | 1W close below this invalidates the bullish setup |
Support | $0.32064 | Chart-marked reference between current price and invalidation |
Resistance | $0.37730 | The 1W close above this confirms continuation. |
Resistance | $0.45089 | First target after breakout confirmation |
Resistance | $0.50000 | Major psychological resistance |
TRON Price Prediction: Bull, Base, and Bear Cases
The base case has TRX continuing to grind along the ascending trendline through most of September, without a confirmed close above $0.37730 or below $0.30846.
The bull case activates on a 1W close above $0.37730, which opens a path toward $0.45089 and eventually the $0.50 psychological level.
This case gets extra support from Tron Inc.'s ongoing treasury accumulation, which adds real corporate demand alongside the technical setup.
The bear case needs a weekly close below $0.30846, which would break the trendline that's supported this entire uptrend and put a deeper pullback in focus.
Every one of these TRON price forecast September 2026 scenarios depends on a confirmed weekly close, not a temporary wick through any level.
Risks That Could Invalidate This Forecast
This bullish setup fails if $TRX cannot close a 1W candle above $0.37730 and fails more seriously if the price closes below $0.30846, which would break the trendline structure that's held for months.
Broader risks include shifts in Bitcoin dominance, macro liquidity conditions, and general crypto market volatility, any of which could override TRON's own chart structure regardless of where its trendlines sit.
Glossary
Ascending trendline: an upward-sloping line connecting a series of higher lows, used to track a prevailing uptrend
Psychological level: a round number that tends to influence trader behavior beyond its technical significance
Weekly close: the final traded price when a weekly candle finishes, used to confirm whether a breakout or breakdown is genuine
Open interest: the total number of outstanding futures or options contracts that have not yet been settled
Support: a price zone where buying pressure has previously stepped in
Resistance: a price zone where selling pressure has previously capped upside
Invalidation level: the price point at which a forecast scenario is considered incorrect
Disclaimer
This article is for informational purposes only and does not constitute financial advice. Cryptocurrency markets are highly volatile, and all price levels discussed are based on technical chart analysis, not a guarantee of future performance. Readers should conduct their own research before making any investment decisions.
Also read:

















