DOGE Breakout Alert: Dogecoin Price Prediction Turns Bullish


Dogecoin is one of the oldest meme coins in crypto, launched back in 2013 as a joke based on the Shiba Inu meme.
It has grown into a coin with a market cap of billions of dollars and a loyal community that keeps pushing it into mainstream conversation.
Right now $DOGE is trading around $0.087, up slightly over the past day.
Traders asking about dogecoin price prediction want to know if this recent bounce has legs or if it fades.
The short answer is that $DOGE has shown fresh strength lately, but whether that turns into a bigger move depends on how price behaves at the levels just above current trade.
DOGE Market Data
Metric | Value |
Price | $0.08692 |
Market Cap | $13.53B |
Fully Diluted Valuation | $14.896B |
24-Hour Trading Volume | $625.638M |
Circulating Supply | 155.661B |
Total Supply | 155.661B |
Max Supply | Infinite |
Source: MarketCap data taken from Coingecko, data as of Aug 27, 2026. Figures may vary slightly across other tracking websites.
Liquidation Snapshot
The last 24 hours saw about $4.26 million in DOGE liquidations, with long positions accounting for $2.85 million of that and shorts making up $1.41 million. 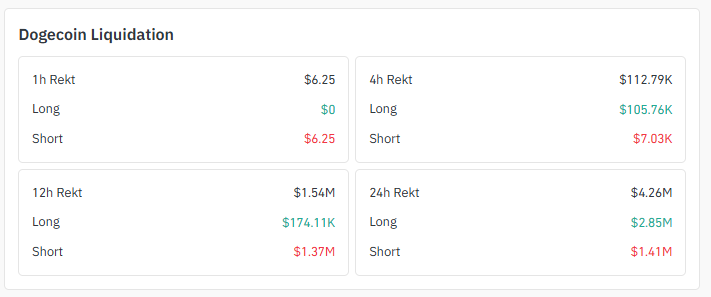
Source: Liquidation Data Taken From Coinglass.
Zooming into the last 12 hours, shorts actually took the bigger hit at $1.37 million against just $174,110 in long liquidations, showing how quickly sentiment flipped as price moved.
The 4-hour window tells the opposite story, with $105,760 in longs wiped out versus only $7,03k in shorts, a sign of late buyers getting caught on the pullback.
Exchange Trading Volume
Binance leads DOGE futures volume at $484.37 million, followed by OKX at $311.44 million and Bybit at $127.52 million. 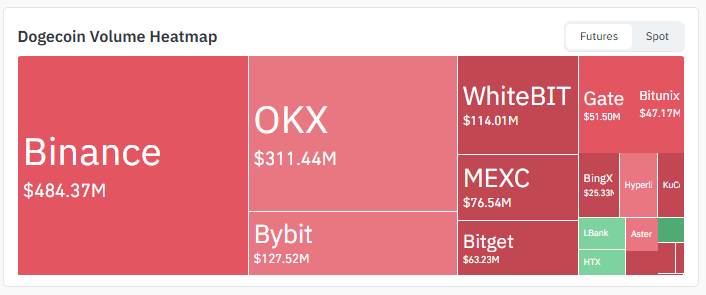
Source: Volume Exchange Data Taken From Coinglass.
WhiteBIT and MEXC round out the next tier with $114.01 million and $76.54 million, respectively, while smaller platforms like Bitget, Gate, and Bitunix contribute to the rest of the activity spread across the market.
Dogecoin News
One widely shared post joked that $DOGE hitting one dollar is closer than people think, a reminder that the community narrative around big round numbers never really goes away.
Source: Data From @DogecoinRise, X Account.
A separate post pointed to on-chain data showing whales added roughly 1.7 billion $DOGE during the recent dip, worth close to $153 million at current prices, suggesting bigger holders are not scared off by the drop.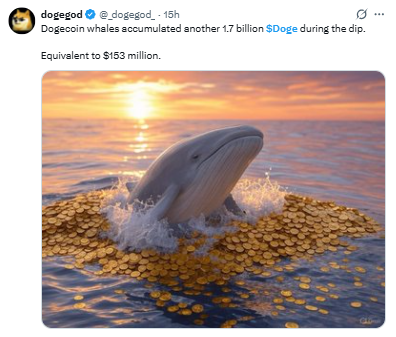
Source: Data From @_dogegod_, X Account.
A third update, a technical breakdown on the 4-hour chart, flagged that DOGE is retesting a key structure level after reclaiming ground, staying constructive as long as price holds above that zone, which matters for near-term dogecoin price prediction sentiment.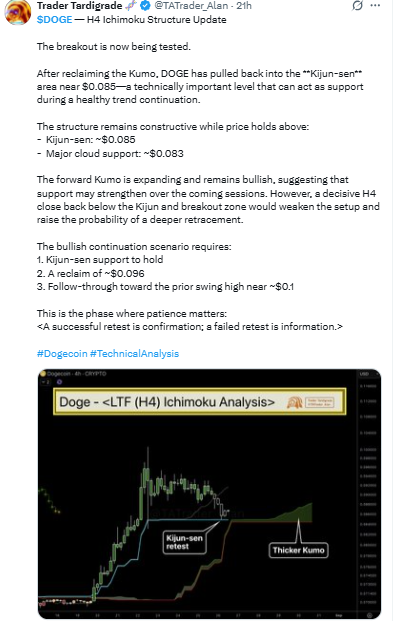
Source: Data From @TATrader_Alan, X Account.
Why it matters: whale accumulation during dips combined with a technical retest that is holding often signals conviction rather than panic, even though price action can stay choppy in the short term.
Key Takeaways
This dogecoin price prediction update covers both the daily and weekly charts.
DOGE is trading near $0.087 after a sharp bounce from its recent demand zone.
Daily chart shows price retesting resistance and the 200 EMA following a trendline breakout.
Weekly chart confirms a falling wedge breakout after DOGE broke out of a descending channel.
Support on the daily chart sits near $0.08387, while resistance stands at $0.10165 and $0.11864.
About $4.26 million in DOGE positions got liquidated in the past 24 hours, mostly longs.
Daily Chart Technical Analysis
On the 1D chart, $DOGE spent weeks stuck below a falling trendline while carving out a tight consolidation zone just above a visible demand area.
That squeeze eventually broke. Price pushed through the trendline and the top of the consolidation box with real force, a sharp green candle that cleared several levels in one session.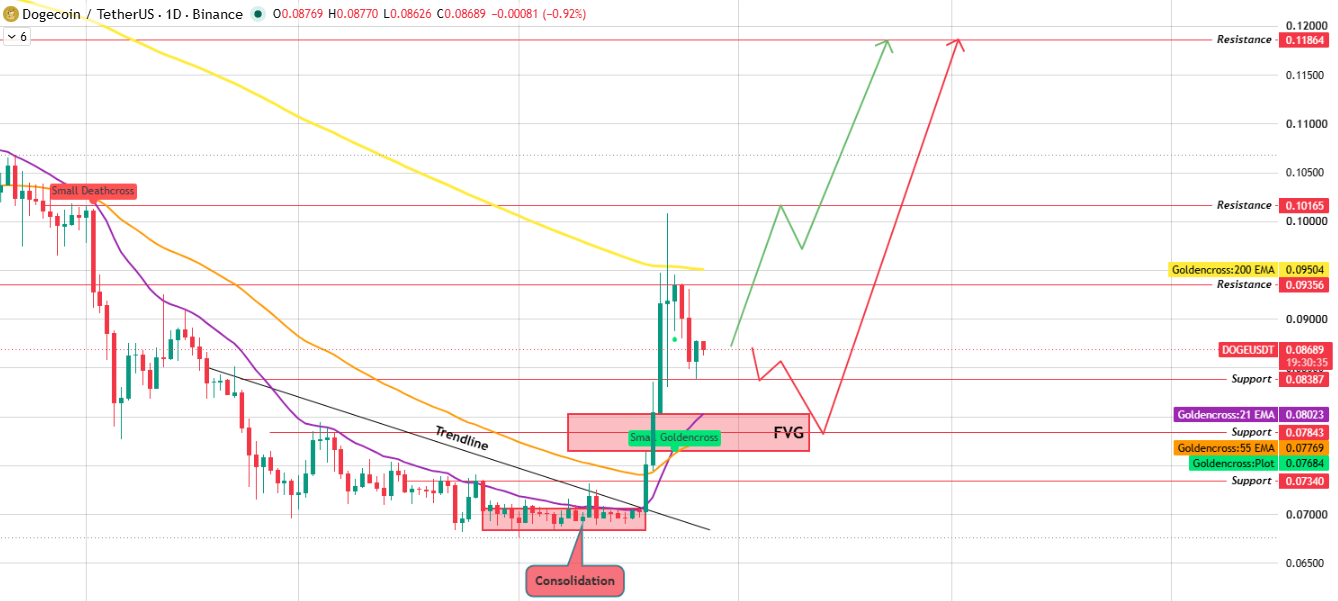
Source: Daily Chart Taken From TradingView.
Now $DOGE has pulled back to retest that broken zone, sitting right under the 200 EMA and just below a nearby resistance line.
This is the part where the dogecoin price prediction gets interesting for short-term traders.
A clean bounce from support that also clears the first resistance could open the door toward $0.10165 and $0.11864.
If sellers push back down instead, DOGE could slip into the fair value gap left behind by that breakout candle.
Fresh volume from there could still send buyers toward the upper resistance zone.
Weekly Chart Technical Analysis
Zooming out to the weekly timeframe tells a similar story from a bigger angle. DOGE had been trapped inside a descending channel for a long stretch before finally breaking out to the upside.
More recently, price broke out of a falling wedge pattern, a structure that often points toward continuation once confirmed.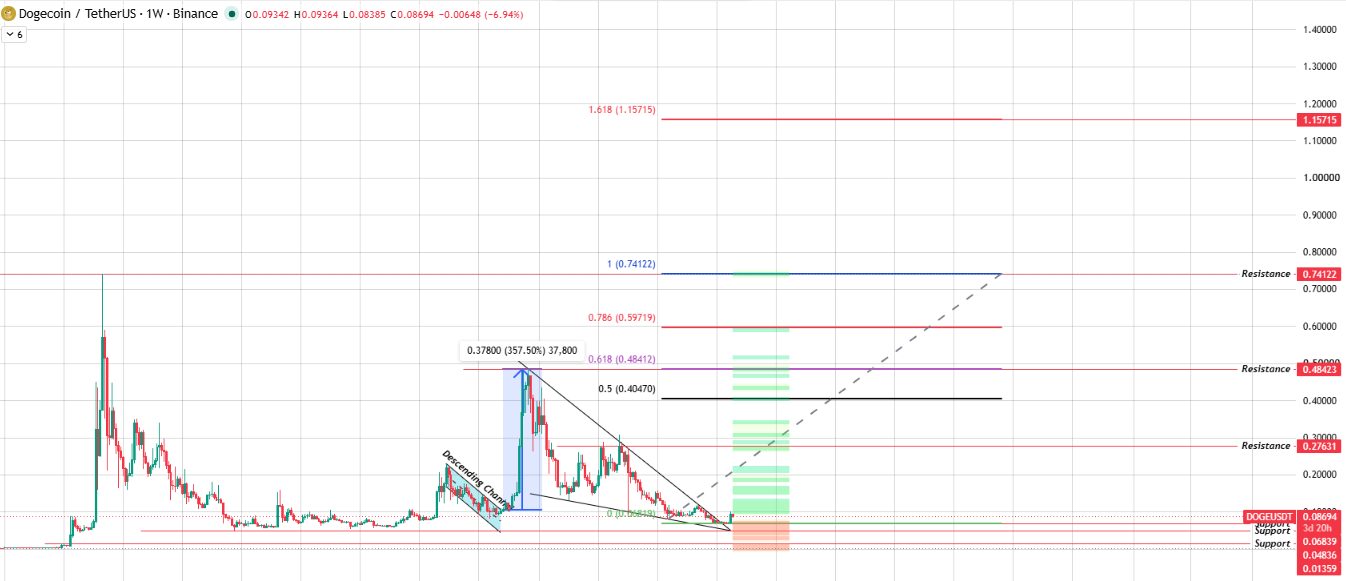
Source: Weekly Chart Taken From TradingView.
If volume keeps flowing in, $DOGE has room to run toward the resistance band near $0.27631 and beyond that toward the $0.48423 zone marked by Fibonacci extensions. But this dogecoin price prediction outlook comes with a catch.
If DOGE gets rejected at the resistance levels above, price could drift back down toward the lower support band closer to $0.06839.
DOGE EMA Levels
EMA | Value |
21 EMA | $0.08023 |
55 EMA | $0.07769 |
200 EMA | $0.09504 |
Daily Support and Resistance
Level Type | Price |
Resistance | $0.11864 |
Resistance | $0.10165 |
Resistance | $0.09356 |
Support | $0.08387 |
Support | $0.07843 |
Support | $0.07340 |
Weekly Support and Resistance
Level Type | Price |
Extended Level | $1.15715 |
Resistance | $0.74122 |
Resistance | $0.48423 |
Resistance | $0.27631 |
Support | $0.06839 |
Support | $0.04836 |
Support | $0.01359 |
Bull, Base, and Bear Case
Scenario | Setup |
Bull | Daily price holds above the retest zone and 200 EMA, clearing $0.10165 and $0.11864, while the weekly chart stays above its broken wedge and pushes toward the $0.27631 resistance band. |
Base | DOGE chops between the daily demand zone and resistance while the weekly chart holds inside its post-breakout range, with the market waiting for a clear volume trigger on either timeframe. |
Bear | Daily support fails, and price fills the fair value gap toward $0.07769 to $0.07684, while weekly rejection at resistance sends DOGE back toward the $0.06839 support band. |
Glossary
A falling wedge is a pattern where price moves lower inside two converging downward-sloping lines, often resolving with an upside breakout.
A fair value gap, or FVG, is a price zone left behind after a sharp move where trading was thin, and price sometimes returns to fill it.
A demand zone marks an area where buyers previously stepped in with enough force to reverse price direction.
Expert Opinion
As per Coingabbar Market Research Analyst, anyone following dogecoin price prediction discussions right now should treat this as a level-to-level market rather than a straight line up or down.
DOGE has done the hard work of breaking its trendline and wedge structures on two different timeframes, which is a meaningful technical shift.
But breaking a structure and confirming it are different things, and $DOGE is currently sitting in that confirmation window.
Watching how price reacts around the 200 EMA and the first resistance band on the daily chart should give a clearer read on whether the bulls can keep control.
Disclaimer: This article is for informational purposes only and should not be treated as financial advice. Cryptocurrency markets are highly volatile, and prices can move sharply in either direction. Always do your own research and consult a qualified financial advisor before making any investment decisions.

















