Zcash Price Prediction September 2026: Can ZEC Hit $1,000?


This Zcash price prediction September 2026 lands right after a move that turned heads across the market.
An ascending trendline that has quietly supported ZEC for months just delivered a fresh higher high, and it did so with one of the most decisive candles the chart has produced all year.
What started as a slow, patient climb along that rising line has now opened up a much bigger question about where this run goes next. Here is the full picture.
Position disclosure: This piece is prepared for informational purposes only. The author holds no position in ZEC at the time of publication.
ZEC Price Today: Live Data and 24-Hour Change
Zcash is currently trading at $777.43, down 1.52% (about $12) over the past 24 hours. The coin's market cap stands at $13.15 billion, with a circulating supply of 16.83 million ZEC — closing in on its 21 million max supply, meaning most of the coin's total issuance is already in circulation.
On the trading side, futures volume of $3.37 billion is roughly 11.5 times higher than spot volume of $292.95 million, an independently calculated ratio showing this move is being driven almost entirely by leveraged traders rather than organic spot buying and selling.
Open interest of $1.51 billion against the $13.15 billion market cap puts leverage exposure at around 11.5%, a moderate-to-elevated reading that leaves room for sharper price swings ahead.
Source: Source: TradingView, ZEC/USDT , 1-week timeframe, Binance, and CoinGlass, both accessed August 27, 2026, IST.
Zcash News and Catalyst
Zcash has been picking up attention from macro voices in the space, not just chart watchers.
Investor Raoul Pal recently disclosed buying ZEC during a market correction, framing the trade around Zcash's privacy features.
In comments shared on X, he described the coin as "Bitcoin with privacy," calling it a straightforward trade.
He went further to argue that the store of value category, long dominated by a single asset, may now have a second contender in Zcash given its added privacy layer, a framing that has helped fuel renewed narrative interest around ZEC alongside the technical breakout on the chart.
Source: X post via WOLF Bitcoin, referencing Raoul Pal commentary on Kast, accessed August 27, 2026, IST.
Quick Take
CMP: $775.91
Weekly trigger: sustained close above the recent breakout high keeps the path open toward $1,000, then $1,500
Weekly failure: close below $453.32 invalidates the bullish structure
Data as of August 27, 2026, IST
Short risk note: these levels come from the weekly chart and depend on confirmed weekly closes, not intraday wicks. Leveraged positions around these zones carry liquidation risk if price whipsaws before a level is confirmed.
As per the chart, the price is 775.91.
Zcash Technical Forecast September 2026
$ZEC has spent a large part of the past year taking support from a rising trendline, using it as a floor through repeated pullbacks rather than breaking down through it.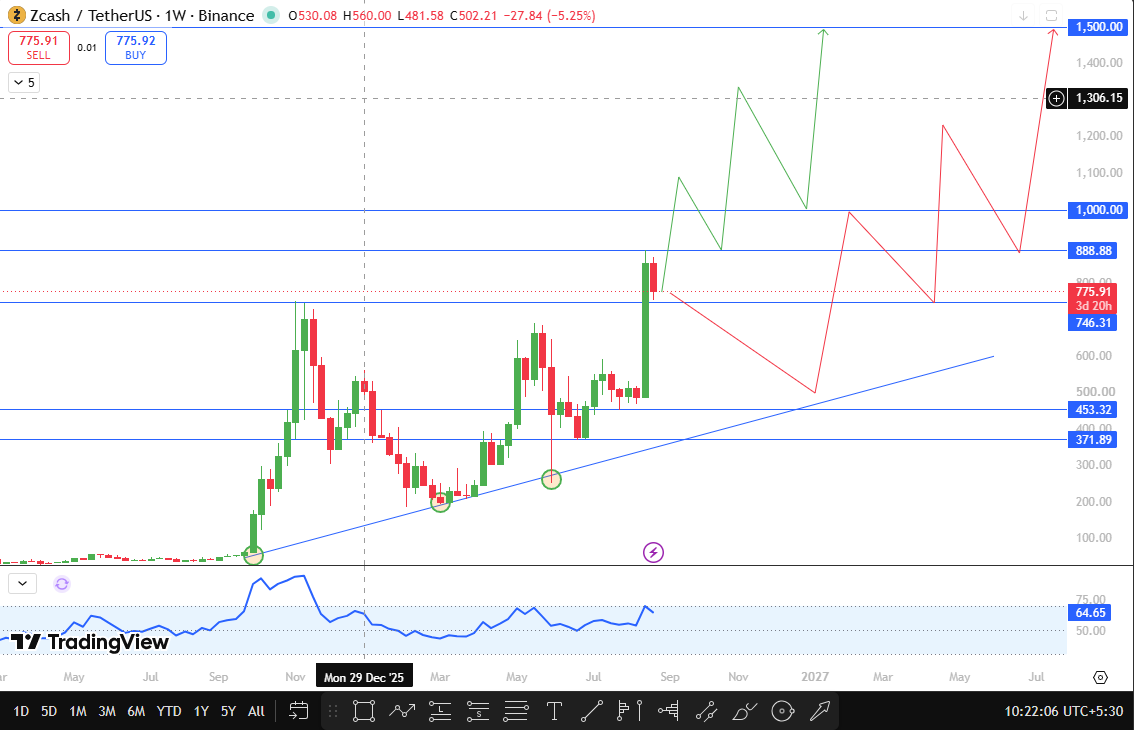
That patient structure just produced its most convincing result yet.
Price pushed above its previous swing high and closed with a large bullish weekly candle, the kind of decisive breakout candle that usually signals buyers have taken firm control rather than just testing the water.
The weekly momentum indicator is currently reading near 64.65, comfortably above the midpoint and showing genuine strength without yet flashing an overheated signal.
If ZEC can sustain above this recent breakout high and deliver a second push higher, the chart points to $1,000 as the next major resistance, a purely psychological but historically significant round number for this Zcash technical analysis in September 2026.
Beyond that, $1,500 stands out as the major upside target, another psychological level that would mark a substantial extension of this current move if the ascending trendline structure keeps holding beneath price.
There is also a more nuanced scenario worth watching. If ZEC loses the old swing high near $746.31, now acting as support after the breakout, that does not necessarily break the bullish case on its own.
A pullback of that kind could send the price back down to retest the ascending trendline itself, and if that trendline holds as it has before, ZEC could still resume higher from there.
The setup only turns bearish if ZEC closes a weekly candle below $453.32, which would mean the ascending trendline has finally failed to hold as support after an extended run of successful defenses.
Source: TradingView, ZEC/USDT, 1-week timeframe, Binance, captured August 27, 2026, IST.
ZEC Support and Resistance Levels to Watch
Level Type | Price | Change from CMP | Note |
Support | $371.89 | -52.07% | Deeper swing low if trendline support eventually fails |
Support | $453.32 | -41.58% | Weekly close below this invalidates the bullish setup. |
Support | $746.31 | -3.82% | Old swing high, now support; a break here can trigger a trendline retest rather than invalidation. |
Resistance | $888.88 | +14.56% | Interim level between the current price and the round-number target |
Resistance | $1,000.00 | +28.88% | First major psychological target after breakout confirmation |
Resistance | $1,500.00 | +93.31% | Major psychological resistance and upside target |
Zcash Price Prediction: Bull, Base, and Bear Cases
The base case has ZEC consolidating around its recent breakout zone through much of September, digesting the sharp move without yet confirming a clean push through $888.88 or losing the $746.31 support.
The bull case activates if ZEC sustains above its recent high and delivers another breakout candle, opening a path toward $888.88 first, then $1,000, and eventually the major psychological target at $1,500.
This ZEC breakout prediction for September 2026 gets support from the strength of the weekly candle that just confirmed the higher high, along with growing narrative attention around Zcash as a privacy-focused store of value asset.
The bear case needs a weekly close below $453.32, which would mean the ascending trendline that has carried this entire structure has finally given way, putting a much deeper pullback in focus.
Even a break of the $746.31 old-high support does not automatically confirm this bear case, since that scenario more often points to a trendline retest rather than a full breakdown, based on how the chart has behaved through this move so far.
On-Chain and Fundamental Drivers
Zcash's core differentiator remains its privacy technology, and that feature is increasingly central to how the asset is being discussed by larger market voices rather than just retail chart traders.
The recent commentary framing $ZEC as a privacy-enabled alternative within the store of value conversation adds a fundamental narrative layer on top of the technical breakout, and narratives like this have historically played a real role in sustaining momentum once a chart confirms a structural shift.
As long as this privacy-coin narrative keeps drawing fresh attention, it gives ZEC a demand driver that goes beyond pure technical positioning.
September 2026 Catalysts
Traders will likely be watching whether ZEC can hold its recent breakout high and push through the $888.88 zone in the coming weeks, since a clean move through that level would strengthen the case for a run at $1,000.
Continued commentary from macro investors around Zcash's privacy use case, along with broader shifts in Bitcoin dominance, overall crypto market liquidity, and general risk appetite, could meaningfully influence this Zcash price outlook for September 2026 through the rest of the month.
Risks That Could Invalidate This Forecast
This bullish setup weakens if ZEC cannot hold above the old swing high near $746.31 and fails more seriously.
If the price closes a weekly candle below $453.32, which would break the ascending trendline that has supported this move through its entire structure.
Broader risks include a fade in the current privacy-coin narrative, shifts in Bitcoin dominance, macro liquidity tightening, and general crypto market volatility, any of which could override ZEC's own chart structure regardless of where its technical levels sit.
How to Buy and Store Zcash
Zcash can be purchased on major exchanges through spot or futures markets, with Binance among the platforms offering active ZEC pairs.
Given Zcash's privacy-focused design, long-term holders often prioritize moving ZEC into a dedicated wallet that supports its shielded transaction features, while active traders may keep smaller amounts on exchange for liquidity around the key technical levels outlined above.
Glossary
Ascending trendline: an upward-sloping line connecting a series of higher lows, used to track a prevailing uptrend
Trendline retest: a moment when price returns to touch a trendline again after an initial move away from it, testing whether it still holds.
Weekly close: the final traded price when a weekly candle finishes, used to confirm whether a breakout or breakdown is genuine.
Breakout candle: a single candle that closes decisively beyond a prior resistance level, often signaling a shift in control between buyers and sellers
Support: a price zone where buying pressure has previously stepped in
Resistance: a price zone where selling pressure has previously capped upside
Invalidation Level: the price point at which a forecast scenario is considered incorrect
Privacy coin: a cryptocurrency designed to obscure transaction details, offering users greater confidentiality than fully transparent blockchains
Disclaimer
This article is for informational purposes only and does not constitute financial advice. Cryptocurrency markets are highly volatile, and all price levels discussed are based on technical chart analysis, not a guarantee of future performance. Readers should conduct their own research before making any investment decisions.

















