Hedera Price Prediction: HBAR Transactions Surge, Eyes $0.10981


Hedera price prediction interest is climbing again, and for good reason.
HBAR has been quietly doing exactly what a healthy uptrend is supposed to do, bouncing right where it needed to, while activity on the actual network has just put up a number that has not been seen in over a month.
When the chart and the on-chain data start telling the same story, that is usually worth a closer look.
Here is the full picture of where Hedera stands right now.
Hedera Price Today: Live Data and 24-Hour Change
HBAR is trading at $0.08053 as of this writing, down a modest 0.64% on the day after slipping about $0.0005, a small dip that looks more like routine noise than any shift in the bigger trend.
Futures volume over the past 24 hours sits at $68.08 million against spot volume of $19.67 million, showing most of today's activity is coming from leveraged traders rather than fresh spot buying.
Hedera's market cap currently stands at $3.52 billion, with open interest at $117.86 million, a fairly modest amount of leverage compared to some of its peers, which can mean less violent swings when the next move actually comes.
Circulating supply is at 43.83 billion HBAR, close to the full total and max. supply of 50 billion, so nearly all the tokens that will ever exist are already in circulation, something worth keeping in mind for anyone building a longer-term HBAR price outlook.
Source: CoinGlass, HBAR market data, accessed September 7, 2026.
Hedera Network Activity Hits A Monthly High
This is the latest news from Hedera that has actually caught people's attention this week.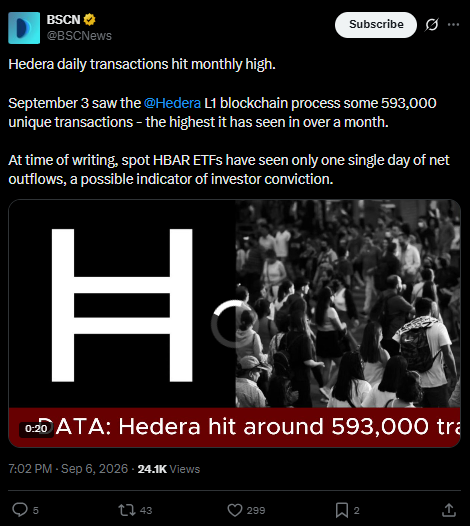
According to a post from BSCN on X, Hedera's daily transactions just hit a monthly high, with September 3 seeing the Hedera L1 blockchain process approximately 593,000 unique transactions, the highest single-day figure the network has recorded in over a month.
That kind of jump in real usage is a meaningful data point for anyone trying to separate genuine network growth from pure price speculation.
The post also flagged something on the ETF side worth noting for Hedera trend analysis purposes: at the time of writing, spot HBAR ETFs had seen only a single day of net outflows since launch, a pattern the post described as a possible indicator of investor conviction.
Steady inflows alongside rising network usage is generally the kind of combination that supports a constructive Hedera technical analysis picture, even if it does not guarantee any particular price outcome on its own.
Source: Post by BSCN (@BSCNews) on X, September 6, 2026.
Quick Take: HBAR Price Action At A Glance
CMP: $0.08067 (4-hour chart, Binance)
Price is holding support from an ascending trendline, with the first retest producing a solid bounce back
4-hour trigger: a fresh trendline bounce followed by a close above 0.08675 opens the path toward 0.10981.
Failure level: close below 0.07288 risks a slide toward 0.06448
Momentum oscillator reading 57.43, having carried repeated bearish tags earlier in the trend
Data timestamp: September 7, 2026, 4h Binance perpetual chart
Risk note: open interest is comparatively light here, meaning price could still move sharply on lower liquidity if sentiment shifts quickly
HBAR Technical Analysis: Trendline Bounce Sets Up The Next Move
Looking at the 4-hour Hedera TetherUS perpetual chart on Binance, HBAR has been climbing steadily while taking support from a well-defined ascending trendline.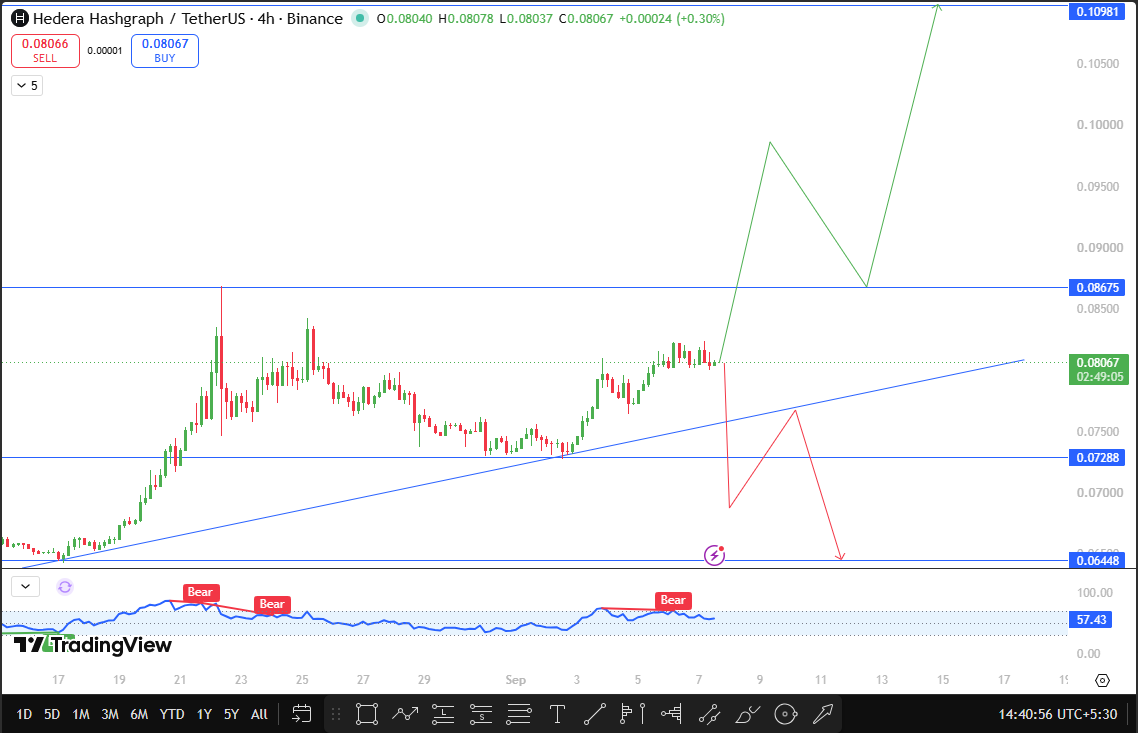
The first real retest of that line produced a good bounce back, a sign that buyers were willing to step in exactly where the structure needed them to, and the price is now trading around $0.08067, sitting close to that same trendline once again.
The momentum oscillator on the chart currently reads 57.43, comfortably above the neutral midpoint even after carrying a few bearish tags earlier in this move.
That kind of recovery in momentum alongside a trendline bounce tends to support the idea that the broader Hedera price forecast remains tilted higher for now, though nothing here rules out further chop before a decisive move.
The level to watch is $0.08675. If HBAR takes support from the trendline again and manages a 4-hour close above this zone, that would open the door toward $0.10981 as the next resistance target, a level that lines up with where the current chart structure has been building toward across its recent legs.
A move of that scale would likely still involve pullbacks along the way rather than a single uninterrupted climb, based on how price has behaved through the earlier stages of this trend.
On the downside, if the trendline finally gives way and HBAR closes below $0.07288, that would mark a real shift in structure. In that case, the next support to watch sits at $0.06448, a level the chart has clearly flagged as the next floor if sellers manage to take control from here.
Source: TradingView, HBAR/USDT Perpetual, Binance, 4h chart, accessed September 7, 2026, 2:49 UTC+5:30.
HBAR Support And Resistance Levels To Watch
Level Type | Price | Distance From CMP |
Major Resistance | $0.10981 | +36.1% |
Resistance 1 | $0.08675 | +7.5% |
Current Price | $0.08067 | — |
Support 1 | $0.07288 | -9.7% |
Major Support | $0.06448 | -20.1% |
Bull Case, Base Case, And Bear Case For HBAR
The bullish scenario here builds nicely on what has already happened once.
If HBAR takes support from this trendline a second time and pushes through $0.08675 with conviction, $0.10981 becomes a realistic next target, and the recent jump in network transactions combined with steady ETF inflows gives this scenario a bit of real-world backing beyond just the chart itself.
The base case would have HBAR spending more time consolidating around current levels, testing the trendline once or twice more before committing to a clear direction.
With momentum sitting just above neutral and open interest fairly light, some additional sideways movement here would not be surprising.
The bearish case shows up if the trendline actually breaks down this time.
A close below $0.07288 would undo the structure that has supported this move since late August, and that kind of failure would likely open the path toward $0.06448, especially if network activity or ETF flows were to reverse course at the same time.
Risks To This Hedera Price Prediction
The recent transaction spike and ETF inflow trend are encouraging, but a single strong day of network activity does not guarantee sustained usage going forward, and it is worth watching whether the 593,000 transaction figure holds up or fades in the coming weeks.
Lighter open interest compared to larger coins also means HBAR can sometimes see outsized moves on relatively modest volume, which cuts both ways.
Broader crypto market sentiment remains a factor too, since a shift in risk appetite across Bitcoin or the wider altcoin space could pull HBAR away from this setup regardless of how constructive the network fundamentals look right now.
Key Terms Explained
Ascending Trendline: A rising support line connecting a series of higher lows, used to judge whether an uptrend remains structurally intact through pullbacks.
Open Interest: The total value of outstanding derivative contracts that remain unsettled, often used as a gauge of how much leveraged money is active in a market.
Net Outflows: A situation where more money is being withdrawn from an investment product, such as an ETF, than is being deposited into it over a given period.
Disclaimer
This article is for informational purposes only and should not be taken as financial advice. Cryptocurrency markets are highly volatile, and price predictions are based on technical analysis that can change quickly with new market developments. Always conduct your own research before making any investment decisions.
Also read:

















