Injective Price Prediction: $INJ All-Time High? as $1B Tokenized


$INJ is pumping hard today. Injective just tokenized over $1 billion in mortgage records, native INJ went live on Coinbase, and staking hit an all-time high above 58 million tokens.
This Injective Price Prediction looks at whether the $INJ coin price can keep running toward $7 and beyond, with the breakout holding above $5.75, or fading back if that level cracks.
Market data was checked on September 8, 2026, at 09:34 IST.
Injective Price Prediction Today: Market Overview
| Metric | Value |
| Price | $6.5458 |
| 24h Change | +16% |
| Market Cap | $649.86M |
| FDV | $647.39M |
| 24h Volume | $219.3M |
| Vol/Mkt Cap (24h) | 33.93% |
| Total Supply | 100M |
| Max Supply | -- |
| Circulating Supply | 99.97M |
Source: Data from CoinMarketCap as of September 8, 2026, at 09:34 IST. Figures may vary slightly across other tracking websites.
Injective Crypto News Today: $1 Billion in Tokenized Assets
Injective's official account confirmed more than $1 billion in residential mortgage records are now tokenized on-chain, with over $10 billion in assets expected to migrate to the chain in the coming months.
Native INJ also went officially live on Coinbase, letting users deposit and withdraw directly without bridging.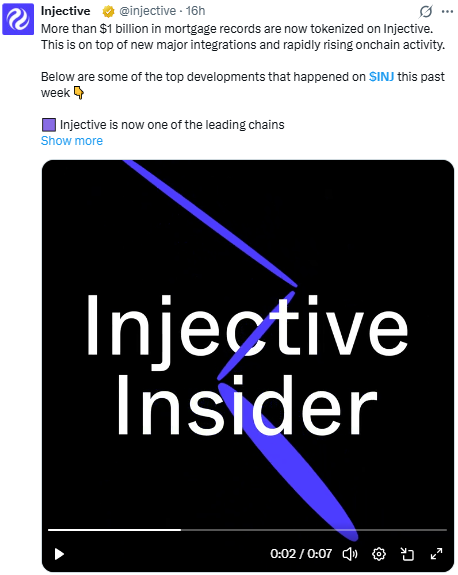
Key Stats:
More than 58 million INJ is now staked on-chain, setting a new Injective record.
Over 7.2 Million $INJ has now been burned with Injective’s novel community buyback.
On-chain revenue and daily on-chain usage are rising week over week, driven by an expanding user base and a vibrant new dApp ecosystem.
Ecosystem News
Trippy Pump and TokenStation officially launched no-code token launchers, giving projects a direct path to create new tokens, memes, and stock perps on Injective.
Injective CEO Eric Chen joined CNBC to explain how registration as an SEC transfer agent supports tokenized funds and private credit.
The world is being tokenized on Injective. Onchain activity is growing. Injective is on track to enable privacy.
Note: CoinGabbar could not independently verify the $10 billion migration figure, since it refers to future onchain activity rather than confirmed data.
INJ Staking Hits All-Time High Amid Injective Price Rally
Injective has reached a new all-time high in total INJ staked, with more than 58.8 million INJ now staked on-chain.
This puts Injective among the leading Layer 1 chains by total staked supply, adding to the bullish backdrop around today's $INJ price prediction.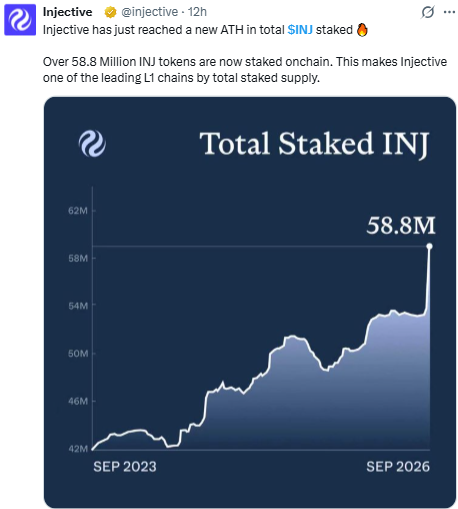
Source: Data From X
INJ Chart Analysis: Trendline Breakout and Key Levels
Pair: INJ/USD · Market: Spot (Crypto) · Timeframe: 1D · Source: TradingView · Timestamp: September 8, 2026, 01:04 UTC-3
$INJ is trading at $6.5458, after breaking above a descending trendline that had capped the price since the August high.
The breakout candle cleared both EMAs in one move, and the price is now holding well above that cluster.
Price confirmed the breakout and is holding above the EMA and key support level, keeping the bullish trend intact.
The EMA readings sit at $5.2315 for the 20-period and $5.0155 for the 50-period, both now acting as support well below current price rather than resistance.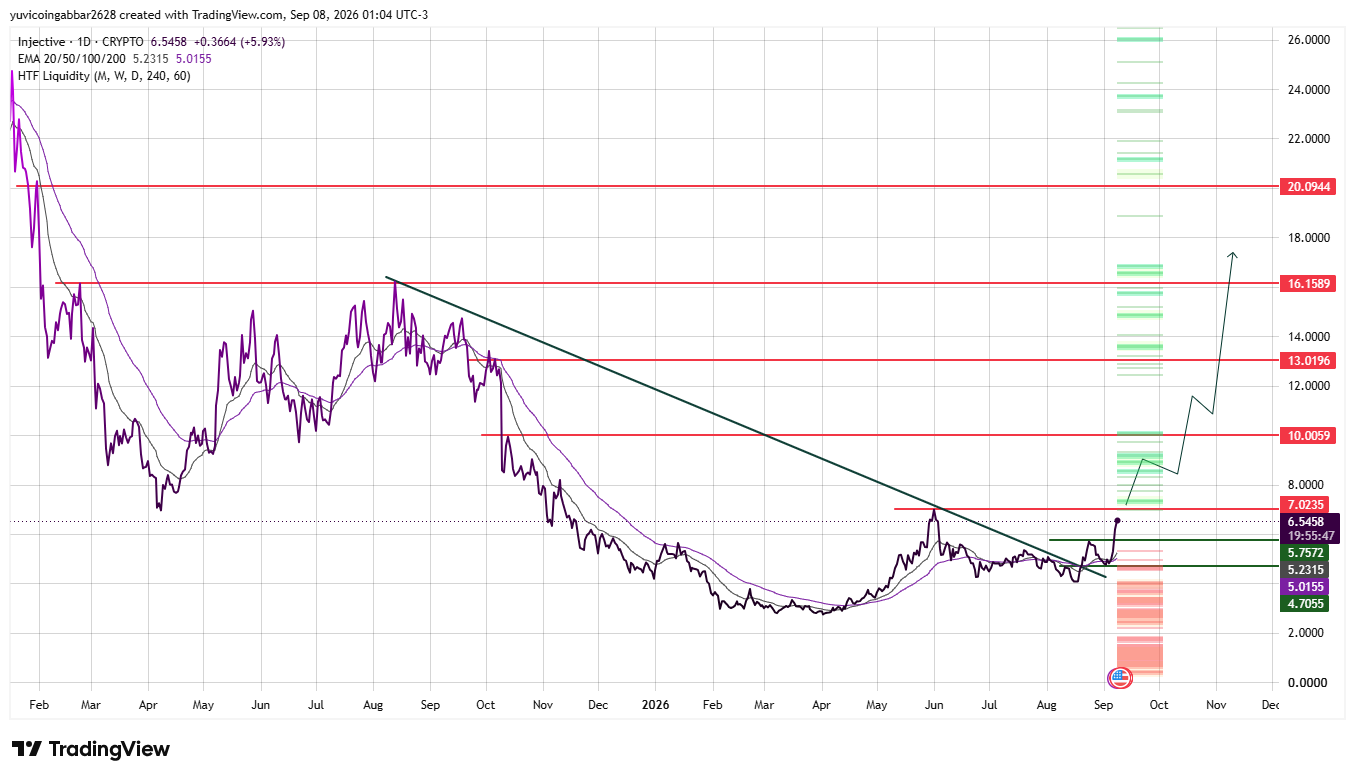
$INJ Future Price: EMA Levels
| EMA | Price |
| EMA 20 | $5.2315 |
| EMA 50 | $5.0155 |
Injective Price Forecast and Outlook: Key Levels to Watch
| Level Type | Price |
| Resistance 4 | $16.1589 |
| Resistance 3 | $13.0196 |
| Resistance 2 | $10.0059 |
| Resistance 1 (nearest) | $7.0235 |
| Immediate Price Reference | $6.5458 |
| First Confirmed Support | $5.7572 |
| Deeper Support | $4.7055 |
The structural high is near $20.0944, well above current levels.
Injective Liquidation and Volume Data (Coinglass Futures)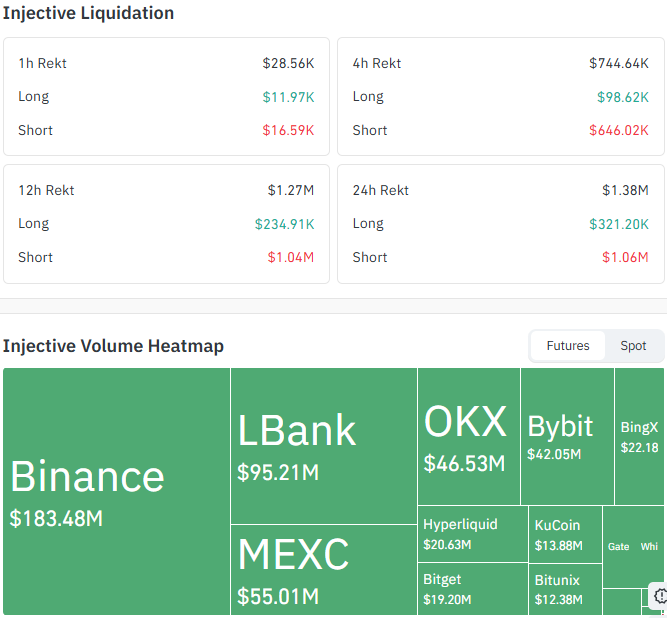
This is Coinglass futures data and stays separate from CoinMarketCap spot volume figures above.
| Window | Total Rekt | Long | Short |
| 1h | $28.56K | $11.97K | $16.59K |
| 4h | $744.64K | $98.62K | $646.02K |
| 12h | $1.27M | $234.91K | $1.04M |
| 24h | $1.38M | $321.20K | $1.06M |
Short positions have taken the bulk of liquidations across every window, consistent with the sharp upside move.
Futures volume is led by Binance at $183.48M, followed by LBank at $95.21M, MEXC at $55.01M, OKX at $46.53M, and Bybit at $42.05M, with smaller volume spread across Bitget, Hyperliquid, KuCoin, and Bitunix.
$INJ Price Prediction: Bull Case vs Bear Case
Bull case: Holding above the first confirmed support at $5.7572 keeps the trendline breakout intact, opening a path toward $7.0235 and then $10.0059 if buying pressure continues alongside the staking and tokenization news.
Bear case: A close back below $5.7572 would put the breakout in question, and a deeper break under the EMA 50 at $5.0155 would expose the $4.7055 support level and suggest the pump was short-lived.
$INJ Price Scenarios: Triggers and Invalidation
| Scenario | Trigger | Likely Outcome | Invalidation Point |
| Trendline reclaim (bullish) | Hold above $5.7572 | Move toward $7.0235, then $10.0059 | Close below $5.7572 |
| Channel hold | Range between $5.7572 and $7.0235 | Consolidation before the next leg | Break of either bound |
| Channel breakdown (bearish) | Close below EMA 50 ($5.0155) | Slide toward $4.7055 | Reclaim of $5.7572 |
Can $INJ Reach $20.09?
$20.0944 is the highest level marked on the chart.
Getting there would take a multi-stage move: clearing $7.0235, then $10.0059 and $13.0196, before any run at $16.1589 and the $20.0944 zone becomes realistic.
$INJ Price Prediction 2026: Expert View
According to CoinGabbar analysts , The trendline breakout, Coinbase's native INJ listing, and the staking ATH all point in the same direction short term.
Short-heavy liquidations suggest the move caught bears offside rather than being purely leverage-driven. $5.7572 is the level that decides whether this holds or fades.
Disclaimer
This piece is for informational purposes only and isn't financial advice. The levels and scenarios above are based on technical chart analysis and publicly available data at the time of writing, and crypto markets can move sharply within hours, so past patterns don't guarantee future outcomes.

















