Litecoin Price Prediction: Can LTC Rally Above $48 Next?


Interest around Litecoin price prediction is heating up again as LTC tries to find its footing after breaking out of a long downtrend line.
For weeks, the coin was stuck in a downward pattern, but fresh buyer interest has pulled the price back toward important resistance areas.
LTC recently made a strong push to test the upper trend boundary, and the price has spent the last few sessions trying to hold above middle levels instead of falling back down.
Whether this move turns into a full rally depends on how the market reacts near key technical levels in the coming hours.
Technical analysis prepared by CoinGabbar's crypto research desk. This piece is for informational purposes only and is not financial advice. CoinGabbar and the analyst do not hold a position in LTC at the time of publication.
The levels described here apply strictly to the 1-hour timeframe covered and should be rechecked if the price closes beyond the stated range.
Trend and Momentum: Key Takeaways
LTC was following a long downward trendline, hitting four clear rejection points before this latest push higher.
Price has now crossed above that trendline, but it is battling to break and stay above the $45.05 level.
A clear move and sustain above $45.05 could open the door toward $45.90, $46.71, and eventually the $48.28 target zone.
If the price fails to hold here and drops below $44.31, focus will shift lower to the $43.65 support area.
RSI near 58.00 looks healthy, backed by two earlier bullish divergence signals near the lows.
Liquidations show more long positions getting cleared on short timeframes (1-hour and 4-hour), while shorts dominate the 12-hour and 24-hour charts.
LTC Price Right Now
Metric | Value |
Price | $45.02 |
24h Change | +1.51% (+$0.6681) |
Market Cap | $3.47B |
Futures Volume (24h) | $303.16M |
Spot Volume (24h) | $29.35M |
Open Interest | $312.21M |
Circulating Supply | 77.46M |
Total Supply | 84.00M |
Max Supply | 84.00M |
Open interest is the total value of derivative contracts still open across exchanges, a rough gauge of active leveraged positioning.
Chart source: LTC/USDT 1-hour contract, TradingView, Binance data feed, captured August 5, 2026, around 03:38 PM UTC+5:30.
Market cap, volume, and supply data from Litecoin market data on CoinGlass were captured the same day.
Methodology and Data Sources
This breakdown looks at the 1-hour chart to track price structure, using volume, open interest, and market cap figures from CoinGlass, liquidation details from CoinGlass's tracker, and ecosystem news directly from official channels.
Levels are considered broken only when a candle closes beyond the level, not just on quick spikes or wicks.
Ecosystem Growth: MWEB Adoption Hits New Record
Aside from what the chart shows, network activity gives us good context for this Litecoin price prediction.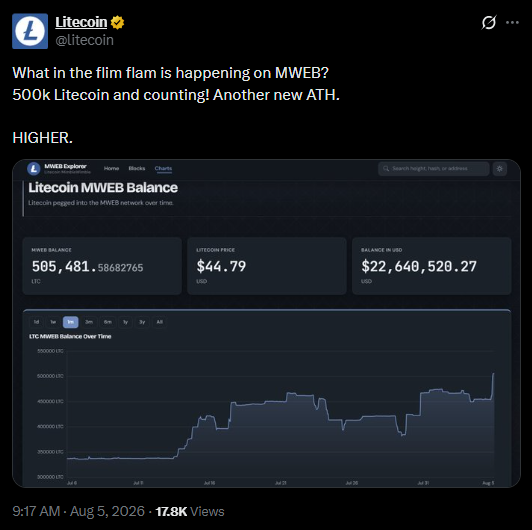
Official updates reveal that total LTC locked in Litecoin's MimbleWimble Extension Block (MWEB) hit a new high, crossing 500,000 LTC (worth over $22.64M).
MWEB brings better privacy and scaling to users. Seeing steady growth here shows real usage on the chain, which often acts as solid backing when the market tries to form a bottom or flip momentum.
Source: Litecoin official network metrics, captured August 5, 2026.
Liquidation Snapshot
Liquidation data shows a clear contrast between short-term intraday moves and broader daily trends.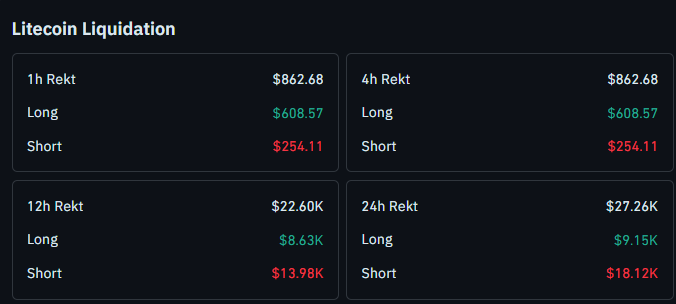
The 1-hour window saw $862.68 liquidated, with $608.57 coming from longs and $254.11 from shorts.
The 4-hour chart reflects the exact same $862.68 total.
Zooming out, short positions take most of the damage. Over 12 hours, total liquidations hit $22.60K, with $13.98K coming from shorts and $8.63K from longs. On the 24-hour chart, total liquidations reached $27.26K, led by $18.12K in shorts against $9.15K in longs.
Source: Litecoin liquidation data, CoinGlass, checked August 5, 2026.
Is LTC Basing Out, or Is This Just A Pause Before More Downside?
Is this trendline an attempt at the start of a real rally, or just a brief pause before another move down? Chart levels are at a big decision point right now.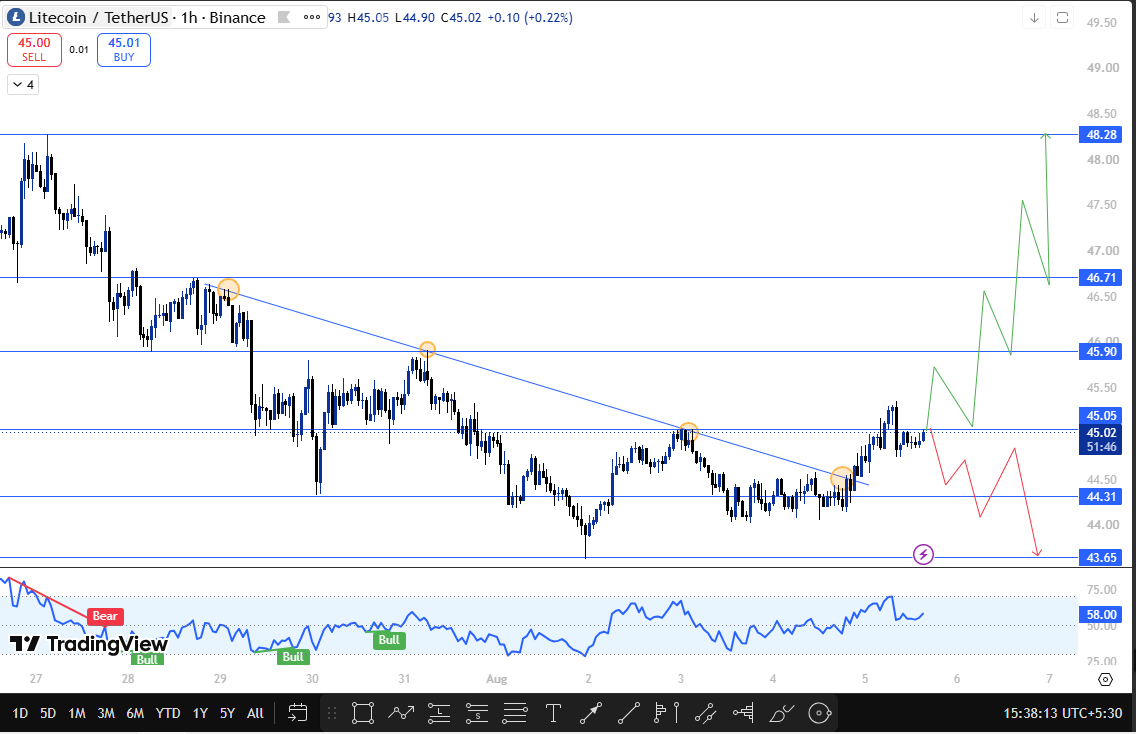
LTC spent weeks under a falling trendline, getting pushed down four separate times. The latest move finally managed to cross above that line, but the price is now running into strong horizontal resistance.
The main level to watch is $45.05. If LTC breaks and holds above $45.05, it confirms buying strength and clears a path toward $45.90, $46.71, and eventually $48.28.
On the other hand, if price falls below $44.31, this immediate breakout attempt loses steam, pointing things back down toward $43.65.
The RSI sitting around 58.00 shows buyers still have an edge, especially after forming two bullish divergence signals during the recent bottoming phase. Still, LTC needs a solid close above $45.05 to confirm the setup.
Technical Outlook Snapshot
Indicator | Signal |
Trend | Trendline broken; working to clear immediate resistance |
Structure | Testing key resistance at $45.05 after holding above $44.31 |
Momentum Oscillator RSI | Near 58.00, holding above 50 after dual bullish divergence signals |
Liquidations | Longs wiped on 1h/4h; shorts wiped on 12h/24h |
Support and Resistance Levels to Watch
Type | Level | Note | % From CMP |
Extended Target | $48.28 | Major upside target on a full extension | +7.50% |
Resistance 2 | $46.71 | Next chart barrier | +4.01% |
Resistance 1 | $45.90 | First key resistance target | +2.20% |
Breakout Trigger | $45.05 | Immediate hurdle; needs a break and sustain | +0.31% |
Current Price | $45.02 | Trading near breakout levels | — |
Breakdown Trigger | $44.31 | Key support; losing this weakens the setup. | -1.34% |
Support 1 | $43.65 | Lower support target if breakdown happens | -2.81% |
Risk-Reward Table
Case | Trigger | Target |
Bull Case | Breaks & sustains above $45.05 | Push toward $45.90, $46.71, and $48.28 |
Bear Case | Closes below $44.31 | Drop toward $43.65 |
What Would Change This Litecoin Price Prediction?
The market remains undecided while price swings between $44.31 and $45.05.
A clear break and hold above $45.05 confirms the bullish move and brings $45.90 and $48.28 into focus.
But if price breaks down below $44.31, the short-term bullish idea fails, making a retest of $43.65 likely.
How Bitcoin Sentiment Could Move LTC Higher
While this analysis focuses on Litecoin's own chart, Bitcoin still controls overall market direction.
If Bitcoin stays steady or trends up, LTC has a much better chance to break and sustain above $45.05 toward higher goals. However, if Bitcoin takes a sharp drop, LTC could easily lose $44.31 support and head down to $43.65.
When This Litecoin Price Prediction Gets Revisited
This Litecoin price prediction will be updated once price closes above $45.05 or below $44.31, or if price continues trading sideways without a clear move for 24 hours.
Glossary
Descending Trendline: A downward line connecting lower high points, acting as dynamic resistance during a price drop.
RSI Divergence: A pattern where price and momentum head in opposite directions, often warning of an upcoming trend change.
Open Interest: The total value of active derivative contracts currently open in the market.
Liquidation: Forced closure of a leveraged position when a trader's account falls below required margin.
MWEB (MimbleWimble Extension Block): An optional feature on Litecoin that offers better privacy and lower transaction data footprints.
Bull, Base, and Bear Case
Bull Case: A break and sustain above $45.05 fuels a rally toward $45.90, $46.71, and $48.28.
Base Case: Price consolidation continues within the $44.31 to $45.05 range.
Bear Case: A candle close below $44.31 confirms breakdown pressure toward $43.65.
Disclaimer
This Litecoin price prediction is based on technical chart analysis and market data available at the time of writing. Cryptocurrency markets are highly volatile, and prices can change rapidly. This content is for informational purposes only and should not be considered financial advice. CoinGabbar and the analyst do not hold a position in LTC. Always do your own research and consult a qualified financial advisor before making any investment decisions.
1 month ago
I lost $222,900 in Ethereum after investing with an online mining company. After realizing I had been scammed, I spent a long time searching for ways to recover my funds and contacted several services without success. During my research, I came across SYLVESTER BRYANT Recovery through Google alot . What caught my attention was that they said they would not require any upfront payment before providing their recovery service, he professionally recover my money back. for service's email him YT7cracker@ gmail (.) com or whsapp [+1 512 577 7957].

1 month ago
i have a problem with my dogecoin in wallet, i lost over $50,000 last week trying to investment not knowing i was investing with a scammer when the times comes for me to withdrawal my savings it was no where to be found then a friend ask me to contact SYLVESTER BRYANT at Yt7cracker@gmail. com if i am serious in getting all what has been stolen from me , After contacting him i follow his procedures and instruction after some time he was able to recover back my stolen dogecoin and also apprehend the scammer


















