MemeCore Price Prediction: $M Exploded Eyes New High?


$M is quietly building momentum, up over 8% while holding a tight base near $1.1275. Traders watching the chart are eyeing a possible breakout setup that could send the price higher if resistance gives way.
This MemeCore price prediction breaks down the chart levels, liquidation activity, and the key zones that matter most right now.
Market data was checked on September 5, 2026, at 11:27 AM IST.
MemeCore Price Prediction: Market Overview
Metric | Value |
Price | $1.1275 |
24h Change | +8.09% |
Market Cap | $2.55B |
Unlocked Market Cap | $2.69B |
Volume (24h) | $1.59M (-17.12%) |
Vol/Mkt Cap (24h) | 0.06463% |
FDV | $11.27B |
Total Supply | 5.41B M |
Max Supply | 10B M |
Circulating Supply | 2.26B M |
Source: Data from CoinMarketCap as of September 5, 2026, at 11:27 AM IST. Figures may vary slightly across other tracking websites.
MemeCore Liquidation and Volume Data
Futures liquidations (Coinglass): over the past 1h, $7.04 was liquidated, entirely from shorts. Over 4h, liquidations reached $244.99 ($237.95 longs, $7.04 shorts).
The 12h total hit $363.40 ($237.95 longs, $125.45 shorts), and 24h liquidations totaled $1.32K ($630.82 longs, $693.40 shorts).
Source: Data From CoinGlass
Futures volume by exchange (Coinglass): BingX leads with $2.30M, followed by Binance at $2.08M and WhiteBIT at $1.59M. KuCoin posted $1.57M, LBank $1.35M, and Bybit $918.43K, with Gate and Bitunix contributing smaller volumes.
This futures data is separate from the CoinGecko spot volume figure above.
$M Chart Analysis: M Price Today and Outlook
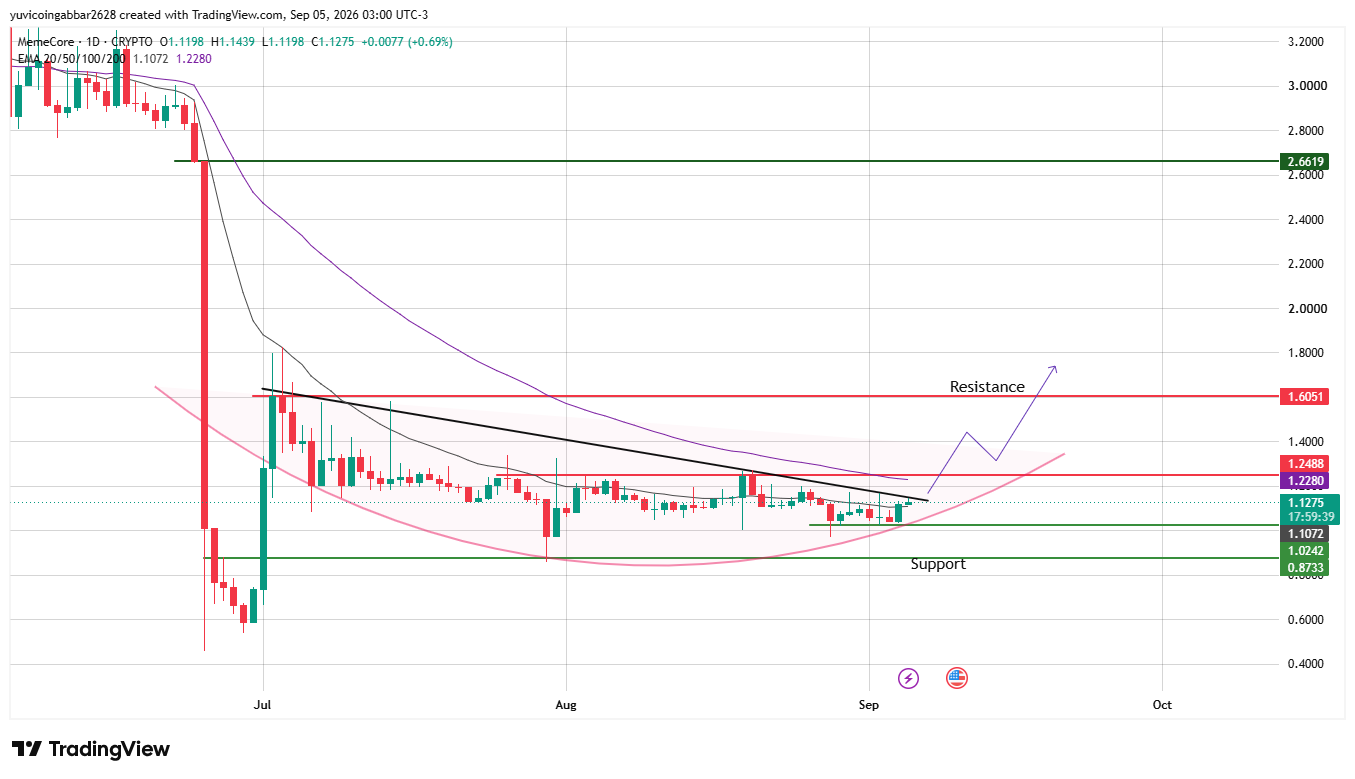
$M EMA 20 sits at 1.1072, and EMA 50 sits at 1.2280. Price is holding just above EMA 20 but still below EMA 50, compressing against a descending trendline and resistance near $1.2488.
Price action has been squeezing tighter against this trendline for weeks.
A clean break and hold above it would be the signal to watch, since price has repeatedly tested this zone without pushing through yet.
MemeCore Price Prediction 2026: Key Levels to Watch
Level Type | Price |
Immediate price reference | $1.1275 |
Nearest support | $1.0242 |
Deeper support | $0.8733 |
Initial resistance | $1.2488 |
Major resistance | $1.6051 |
Extended resistance | $2.6619 |
Bull Case vs Bear Case
Bull case: M holding above $1.0242 keeps the base intact. A break and hold above $1.2488 would confirm the trendline break, opening a path toward $1.6051, with $2.6619 as a far longer-term level if momentum keeps building.
Bear case: Losing $1.0242 would break the current structure, risking a slide toward $0.8733. A close below $0.8733 would invalidate the bullish setup and point to a deeper correction instead of a breakout.
$M Price Scenarios: Triggers and Invalidation
Scenario | Trigger | Likely Outcome | Invalidation Point |
Trendline reclaim (bullish) | Break and hold above $1.2488 | Move toward $1.6051 | Close back below $1.2488 |
Channel hold | Price stays between $1.0242 and $1.2488 | Continued consolidation | Break of either boundary |
Channel breakdown (bearish) | Close below $1.0242 | Drop toward $0.8733 | Reclaim of $1.0242 |
MemeCore Price Forecast: Can $M Reach $2.6619?
$2.6619 marks the highest resistance visible on the daily chart.
M would first need to clear $1.2488, then hold above EMA 50 at $1.2280, before targeting $1.6051 as an intermediate stop on the way up.
Reaching $2.6619 would require a sustained multi-stage rally well beyond the current trendline break, not a single move.
MemeCore Outlook: Expert View
According to CoinGabbar analysts, This MemeCore price prediction hinges entirely on the trendline near $1.2488.
Until that breaks with volume, this remains a waiting game rather than a confirmed move, and traders should watch $1.0242 as the level that keeps the setup alive.
Disclaimer
This article is for informational purposes only and should not be considered financial advice. Cryptocurrency markets are highly volatile. Always do your own research before making investment decisions.
















