MemeCore Price Prediction: The $M Move Traders Can't Ignore


$M is sitting near $1.05 right now. Back in July 2025 this token debuted near $0.035, then climbed fast enough to briefly overtake Shiba Inu in meme coin market cap.
So even after today's sharp drop, M is still miles ahead of where it started.
Anyone tracking this memecore price prediction should keep that in mind alongside the daily chart; the price has hit a level that'll likely decide the next move.
Live $M Price Data
MemeCore is currently trading at $1.05, a down of about 7.4% over a day that clearly wasn't kind to MemeCore holders.
The 24-hour range says it all, swinging from $1.05 up near $1.15, a wide spread for such a short window. 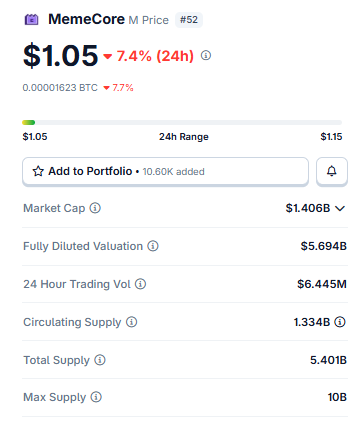
Source: $M market cap data taken from Coingecko, data as of Aug 10, 2026. Figures may vary slightly across other tracking websites.
Market cap's sitting around $1.406 billion right now, though fully diluted valuation tells a bigger story at roughly $5.694 billion.
Why the gap? Circulating supply is 1.334 billion, but max supply runs all the way to 10 billion, meaning there's a lot of token still to come.
Daily volume clocked in near $6.445 million. Anyone reading into a meme or price prediction should keep that supply gap in the back of their mind; it's going to matter down the line.
Liquidation Data and Exchange Volume
$128.61K was wiped out over the last day, and almost all of it, $122.16K, came from longs. Only $6.44K on the short side. 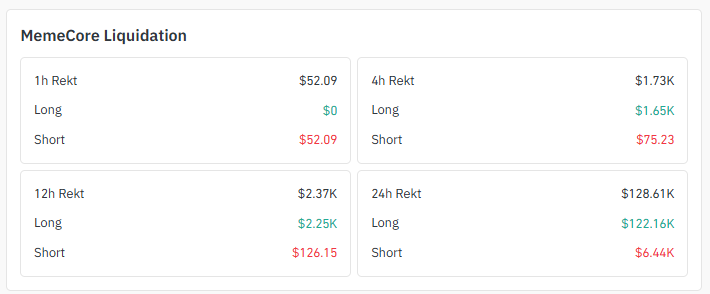
Source: Liquidation Data Taken From Coinglass .
That kind of imbalance tells you exactly who got caught leaning the wrong way during this drop. Same pattern in the 12-hour window too: $2.37K total, long eating, most of it again.
But here's a twist: the 1-hour window flipped entirely, with $52.09 in liquidations, all shorts this time. Might just be some short-term dip buying or covering kicking in.
Volume-wise, it's basically a Binance show, $5.62 million there alone, more than everywhere else combined. 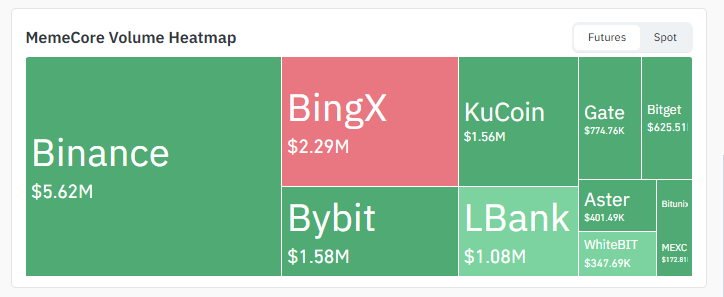
Source: Heatmap Data Taken From Coinglass.
BingX picks up $2.29 million, and Bybit and KuCoin trail close together around $1.5 to $1.6 million each.
Everything else, Gate, Bitget, LBank, Aster, and WhiteBIT, gets whatever's left over.
Key Takeaways
-
Down 7.4% to $1.05. Not a small dip; this one actually hurt
-
There's a support level directly underneath the current price, and it matters
-
Longs got wrecked in the past 24 hours, $122K worth versus barely $6K on shorts
-
Nearly all the volume is happening on one exchange. Guess which
-
Oversold-ish on both charts, RSI hovering in the low-to-mid 30s
Technical Analysis: What The Charts Are Saying
4-Hour Chart Analysis for Memecore Price Prediction
Price has been sliding inside a descending channel, and it's now testing the lower boundary of that channel right around current levels. 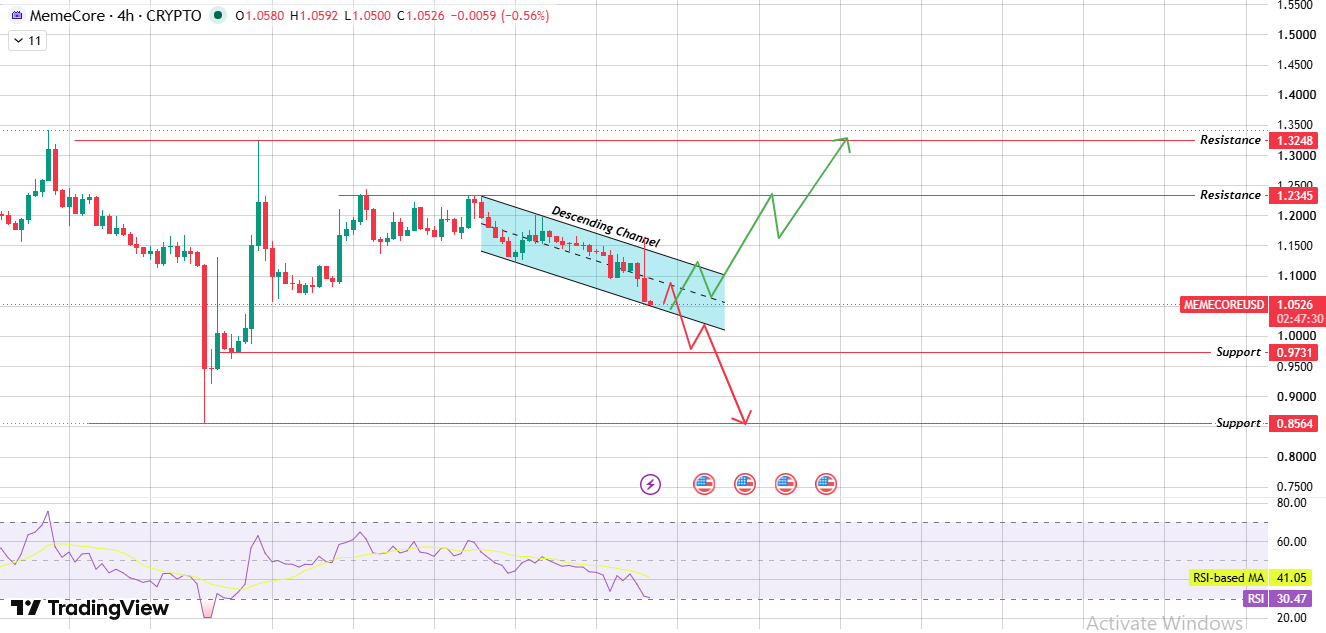
Source: Chart Taken From TradingView.
If the channel breaks upward, resistance at $1.2345 comes into view first, then $1.3248 above that.
But a confirmed breakdown below the channel opens the door to support at $0.9731, and if that fails too, $0.8564 is next.
RSI here reads just 30.47, edging into oversold territory, which sometimes precedes a bounce.
Daily Chart Analysis for Memecore Price Prediction
Zoom out, and $M is compressed inside a symmetrical triangle, with price now hovering near the apex where the pattern typically resolves. 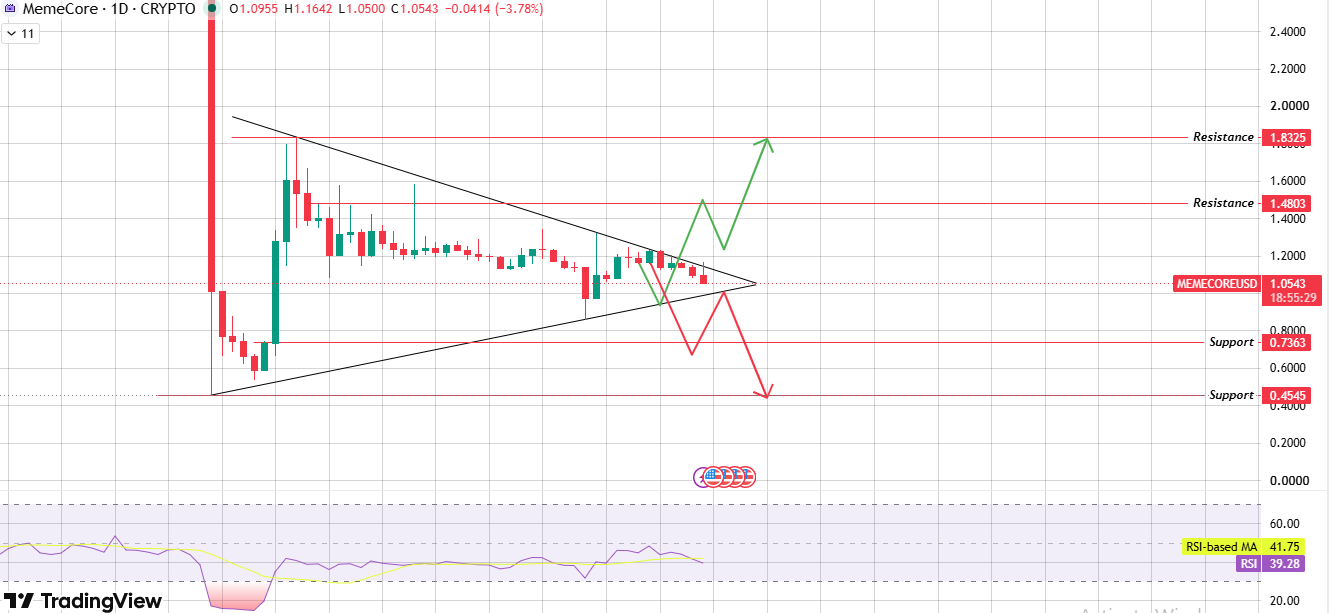
Source: Chart Taken From TradingView .
A break above the triangle's resistance line points toward $1.4803, and a stronger move could stretch to $1.8325.
A breakdown instead sends the price toward $0.7363 first, with $0.4545 as the deeper support beneath that.
Daily RSI sits at 39.28, still on the weaker side but not deeply oversold yet.
Bull, Base, and Bear Case
Expert Opinion
Most of the talk around MemeCore right now circles back to just how one-sided that liquidation wipeout was.
Some analysts figure this kind of flush actually helps, shakes out over-leveraged longs, and leaves room for a cleaner base if support holds Not everyone agrees, though.
A more cautious camp says until $M actually reclaims $1.20 or so, this memecore price prediction probably shouldn't lean bullish just yet, no matter how oversold things look on paper.
Long-Term Outlook
Everything kind of hinges on that daily triangle.
Which way does it break? A clean move above resistance, especially with volume spreading out beyond just Binance, would push the broader memecore price prediction toward something more optimistic.
But if support keeps getting tested and eventually fails, the deeper levels from the bear case come into play.
None of this is fixed in stone; obviously, it's a read on the current structure, and structure shifts as new candles print.
Glossary
Picture two parallel trendlines sloping down together, price bouncing between them, that's a descending channel in a nutshell.
A symmetrical triangle ? Flat support on the bottom, resistance sliding lower and lower on top, until the whole thing eventually snaps one way or the other.
When a trader's leveraged position gets force-closed because losses piled up too fast, that's a liquidation.
RSI measures momentum on a 0-to-100 scale, and it's usually how traders spot when something's gotten overbought or oversold.
Ever seen FDV thrown around? It's short for "Fully Diluted Valuation," basically what a token would be worth if every last coin, including ones not yet released, was already circulating.
Methodology
This memecore price prediction is built on TradingView chart readings across the 4-hour and 1-day timeframes, combined with liquidation and volume data pulled from Coinglass.
Every level mentioned here, support or resistance, comes straight off visible chart structure. Nothing's extrapolated or guessed.
Markets shift quickly, though, so treat this as one useful input, not the final word, when deciding what to do next.
Disclaimer: This article is for informational purposes only and does not constitute financial advice. Cryptocurrency markets are highly volatile, and past price behavior does not guarantee future results. Always conduct independent research before making investment decisions.

















