NEAR Protocol Price Prediction August 2026: Targets and Risks


NEAR Protocol built its pitch around sharded infrastructure meant to stay fast and cheap even as usage scales, positioning itself for AI agents and everyday apps rather than competing purely on hype.
That background is useful context, but this near protocol price prediction August 2026 is really about what the charts are showing right now.
$NEAR sitting at $1.62, up 2.0% on the day, holding steady on the daily timeframe while a much bigger story plays out underneath on the weekly chart.
NEAR Protocol Price Today: Live Data and 24-Hour Change
$NEAR Currently trades at $1.62 right now, up 2.0% over the last 24 hours, after moving through a range of $1.57 to $1.64. 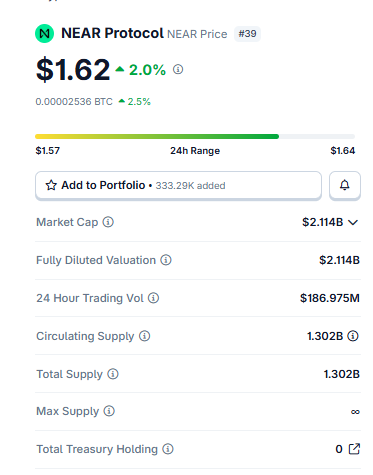
Source: Near protocol market cap data taken from Coingecko, data as of July 30, 2026. Figures may vary slightly across other tracking websites.
Market cap sits at $2.114B, and fully diluted valuation lands at that same $2.114B figure, worth pausing on, since it means there's no looming unlock overhang the way there is with a lot of other altcoins right now.
Trading volume over the past day came in at $186.975M.
Circulating supply and total supply are both 1.302B NEAR, and max supply is uncapped, since $NEAR runs on modest ongoing issuance instead of a hard ceiling. The project's treasury holding currently shows 0.
Technical Analysis: Key Support and Resistance Levels
NEAR Protocol Daily Chart Analysis
On the daily chart, $NEAR has been trading against a descending trendline for weeks.
The latest candle opened at 1.622, reached a high of 1.643, dipped to a low of 1.606, and closed at 1.624, up a small 0.12%. 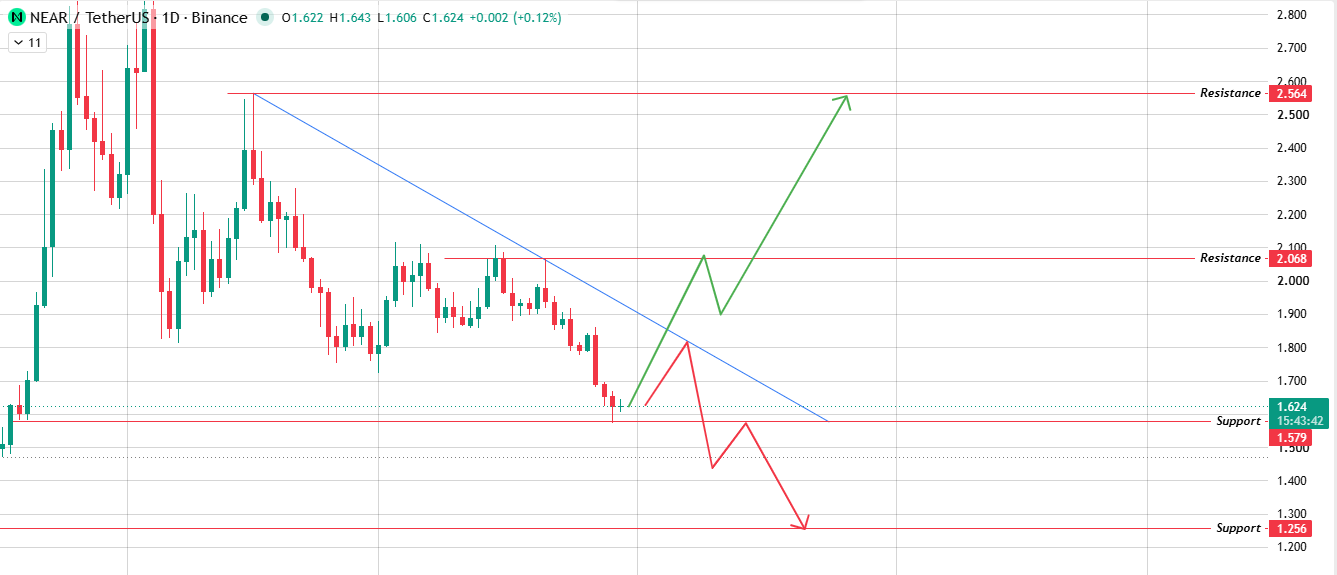
Source: Chart Taken From TradingView.
Price is now pressing right against that trendline, which is exactly the kind of spot where a breakout or another rejection usually happens.
Clear it with decent volume, and resistance stacks up at $2.068, then $2.564 above that.
But if the move fails, or volume just doesn't show up behind it, price is more likely to slide back toward $1.579 first, and possibly $1.256 if that support level to watch doesn't hold either.
NEAR Protocol Weekly Chart Trend Analysis
Zooming out to the weekly chart, the picture looks different.
$NEAR dropped sharply in recent weeks the latest weekly candle opened at 1.838, hit a high of 1.860, fell all the way to a low of 1.571, and is running at 1.626, an 11.49% weekly loss. 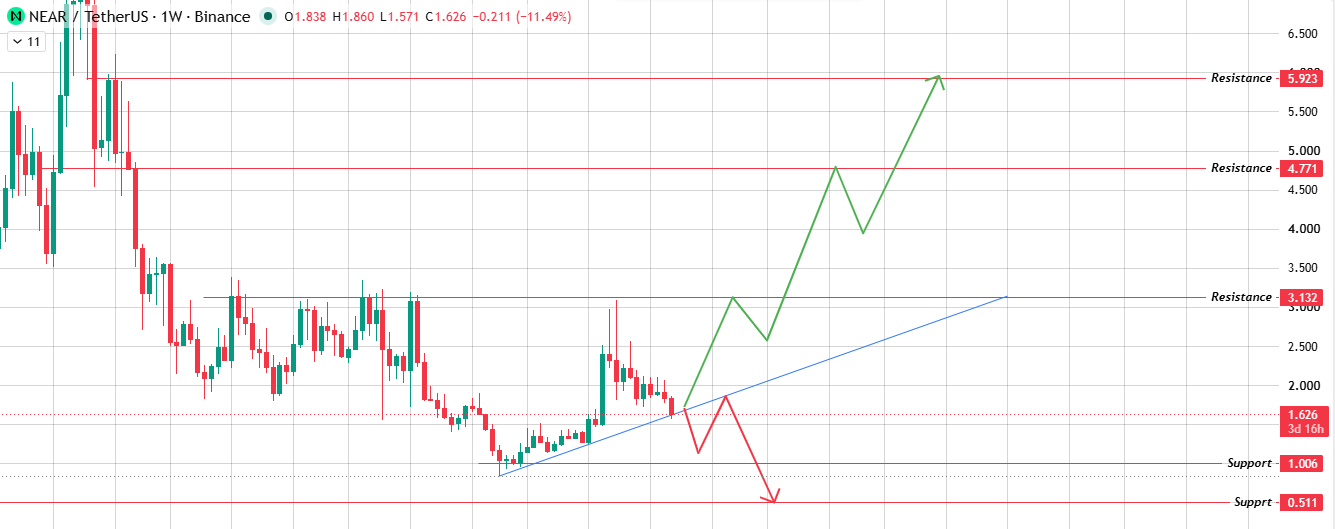
Source: Chart Taken From TradingView.
Since that low, the price has been printing higher lows against a rising support trendline, the early shape of a reversal forming right around current levels.
Hold that trendline and clear the horizontal resistance sitting above it, and the targets get considerably bigger: $3.132 first, then $4.771, with $5.923 as a genuine longer-term stretch target if this $NEAR bullish forecast plays out in full.
Lose that trendline instead, and the drop could stretch toward $1.006, with $0.511 as the deeper worst-case level on the chart.
NEAR Protocol Price Prediction August 2026: Bull, Base, and Bear Cases
Strip this near protocol price target 2026 question down to its core: can $NEAR clear the daily resistance stacked above it while the weekly chart's early reversal structure stays intact, or does the broader downtrend pull it back down first?
For the bullish forecast to play out, $NEAR needs real volume to actually clear the daily trendline while the weekly ascending structure holds underneath it.
Get that, and $2.068 comes first, then $2.564, with the bigger weekly targets opening up if momentum keeps building.
The base case is a lot less exciting; the price just keeps chopping between the daily support and resistance bands without picking a side.
The bearish scenario kicks in the moment $1.571 breaks and holds, since that's the one level showing up on both the daily and weekly charts at once, not just one of them.
On-Chain and Fundamental Drivers (NEAR Protocol)
The fact that $NEAR market cap and fully diluted valuation are already sitting at the same number is the standout detail in any NEAR outlook right now.
Unlike coins with huge amounts of locked supply still due to unlock, NEAR's entire 1.302B token supply is already circulating, with one less overhang capping upside compared to a lot of other altcoins.
The empty treasury holding also means there isn't an obvious pool of tokens waiting to hit exchanges unexpectedly, though NEAR's uncapped max supply does mean gradual dilution stays a permanent background factor worth watching over the long run.
August 2026 Catalysts That Could Move NEAR Protocol
Continued rollout of NEAR's AI-focused infrastructure, new ecosystem partnerships, and steady developer activity are the main NEAR-specific things worth tracking this month.
Beyond that, broader altcoin liquidity conditions and general risk appetite across the market will probably matter just as much, since NEAR tends to move with the wider market's mood as much as on its own news.
What Analysts Are Forecasting (NEAR Protocol)
Anyone running a NEAR trend analysis right now is basically looking at two different stories depending on the timeframe picked.
The daily chart shows a token testing resistance after a rough stretch, still needing to prove it can actually break through.
The weekly chart shows a much sharper downtrend that may be carving out a bottom, with the price now testing a rising trendline for the first time since the drop began.
Sentiment in this NEAR Protocol price prediction chart stays cautiously constructive as long as $1.571 holds and turns more defensive the moment it doesn't.
None of this is personalized financial advice, just chart-based analysis, and crypto remains volatile enough that no past pattern guarantees what comes next.
NEAR Protocol Long-Term Outlook: 2027 to 2030
If $1.571 holds through the rest of 2026, and the weekly structure keeps building the way early reversal patterns often do, a longer climb toward $3.132 and potentially $4.771 looks reasonable stretched across 2027 and 2028.
Where NEAR Protocol's future price actually lands by 2030 will likely depend far less on any single chart level and more on real adoption of its infrastructure by developers and AI-related applications, rather than short-term price swings alone.
Risks That Could Invalidate This Forecast (NEAR Protocol)
The clearest risk here is a confirmed weekly close below $1.571, the one NEAR Protocol resistance-turned-support level both timeframes are converging on.
That opens a path toward $1.256 in the near term, and the deeper weekly levels near $1.006 and $0.511 if the broader downtrend reasserts itself.
On the flip side, a genuine volume-backed breakout above the daily trendline could push $NEAR through resistance faster than the bull case above assumes, especially if the weekly reversal structure confirms at the same time.
How to Buy and Store NEAR Protocol Safely
$NEAR is available on most major exchanges, usually paired against USDT, USD, or BTC.
Since the full token supply is already circulating, near-term price action is driven more by demand and sentiment than by any looming unlock schedule.
Hardware wallets remain the safer call for larger, longer-term holdings, while software or exchange wallets work fine for smaller amounts being traded more actively.
Disclaimer: This near protocol price prediction is for informational and educational purposes only and should not be considered financial or investment advice. Cryptocurrency markets are highly volatile, and prices can change rapidly. Always conduct your own research and consult a qualified financial advisor before making any investment decisions.









.jpg)








