Official Melania Meme Price Prediction: What Is Driving MELANIA Today?


One coin nobody expected to move just posted one of its wildest days in months, and the chart is not the only thing worth looking at.
The Coin That Refused to Stay Quiet
Something strange happened this week, and it did not come with a press release. A meme coin tied to a name most crypto traders had written off months ago suddenly ripped higher, dragging volume and whale wallets into the spotlight. Official Melania Meme price prediction searches spiked right alongside it.
There's no confirmed announcement behind the move. No listing news, no partnership drop. Was this organic buying, or just meme coin physics doing what meme coins do? The data below does not give a clean answer.
Key Takeaways
MELANIA traded near $0.1362 as of August 22, 2026, around 14:00 UTC, up roughly 67% in 24 hours.
There's no single confirmed catalyst; the move looks like a high-volume speculative breakout typical of memecoin trading.
Daily RSI sits above 90, a level that usually signals an overheated, short-term exhausted market.
Whale wallets control close to 90% of supply, with treasury and team vaults holding the largest share.
Our MELANIA price prediction sees a base case holding between $0.10 and $0.16 over the next month, with invalidation below $0.065.
Why Is MELANIA's Price Moving Today?
There isn't a tidy explanation this time. Market trackers point to a high-volume speculative breakout with no clear single trigger and more community momentum than confirmed news. The token's up 82.99% over the past week, badly outpacing a broader crypto market that only rose around 5.91% in the same window. That gap matters. It means buyers rotated specifically into MELANIA rather than riding a general market wave.
Retail interest, thin order books, and short covering likely compounded each other here. Meme coins with low float liquidity can move ten times faster than large-cap tokens on similar buying pressure. Traders watching MELANIA crypto news should treat this as sentiment-driven, not fundamentals-driven, at least for now.
Broader sentiment shifts are worth tracking too, and the latest crypto news roundup is a good place to catch anything that moves the wider market before it hits individual tokens like MELANIA.
Where MELANIA's Price Stands Right Now
Here's the full snapshot, captured via CoinMarketCap as of August 22, 2026, around 14:00 UTC:
Metric | Value |
Price | $0.1362 |
24h Change | +67.29% |
Market Cap | $136.23M (+69.48%) |
24h Trading Volume | $18.19M (+126.97%) |
Volume / Market Cap | 11.3% |
Fully Diluted Valuation | $138.02M |
Liquidity / Market Cap | 11.41% |
Circulating Supply | 999.99M MELANIA |
Total Supply | 999.99M MELANIA |
Holders | 222.82K |
CertiK Rating | 2.5 / 5 |
All-Time High | $13.73 (Jan 20, 2025) -98.93% from current |
All-Time Low | $0.06609 (Jun 6, 2026) +122.63% from current |
Zoom out and the picture gets rougher. Context, like the all-time high and all-time low, matters more than the headline 24-hour percentage move on its own.
It also helps to know what's coming next. The upcoming coin events calendar flags unlocks, listings, and announcements that could shift this data quickly.
MELANIA Technical Analysis: Daily and Weekly Chart
Daily Chart Structure
On the daily TradingView chart, MELANIA opened near $0.09115, traded as high as $0.16348, and trades around $0.13423, a 47.10% single-day gain. Price broke clean out of a descending channel that had capped it for months. 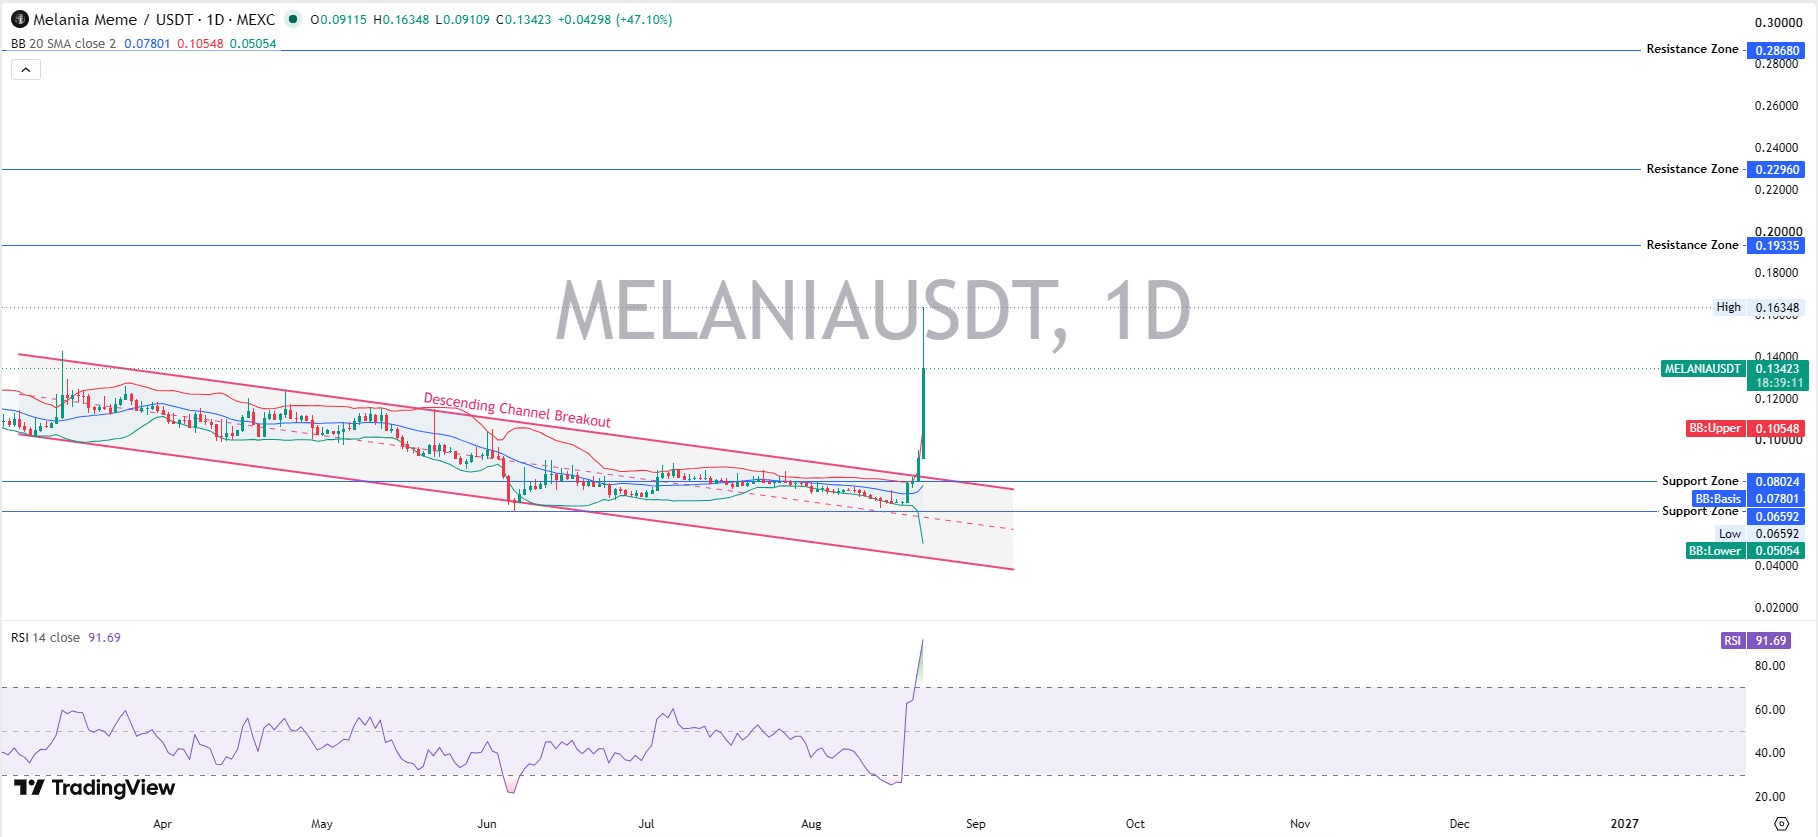
The Bollinger Band structure shows the upper band at 0.10548 and the baseline at 0.07801, both now sitting well below live trades, which confirms the breakout is real, not noise.
Support zones cluster at $0.08024 and $0.06592. Resistance zones stack up at $0.19335, $0.22960, and $0.28680.
Daily RSI reads 91.69. That's extreme. Being overbought this deep almost always precedes a cooling-off period, even inside an uptrend.
Weekly Chart Structure
Weekly trading tells a slower story: it opens near $0.07000, high of $0.16348, trades around $0.12082, up 72.77% for the week. 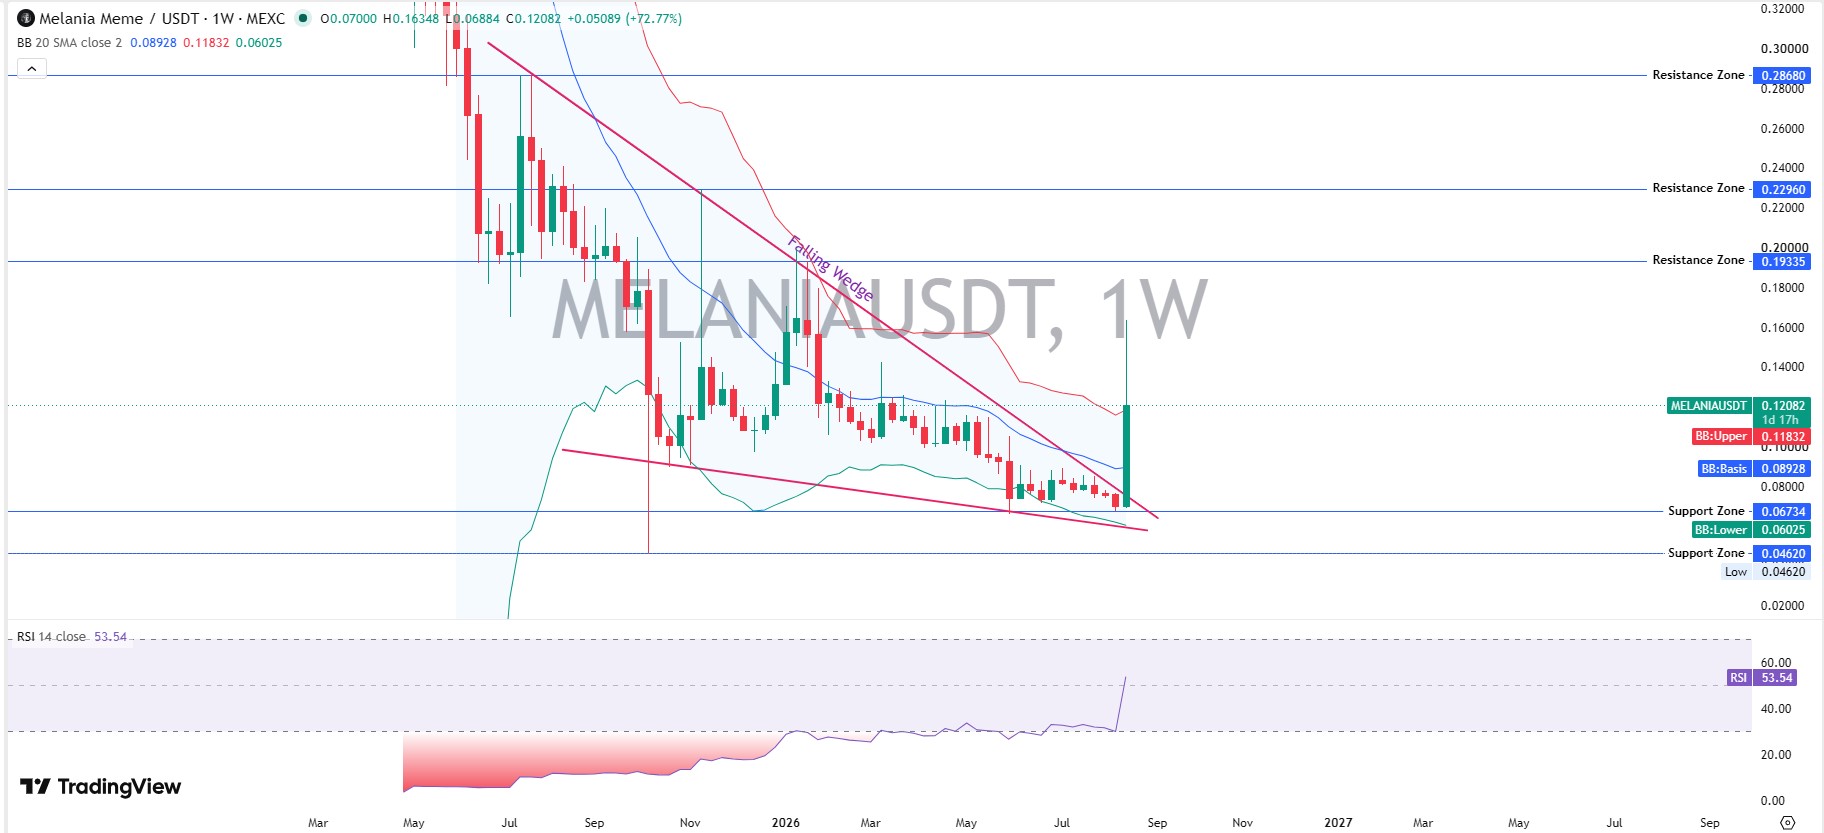
A falling wedge pattern that had been compressing price since mid-2025 just broke to the upside.
Weekly RSI sits at a calmer 53.54, meaning the bigger timeframe hasn't overheated the way the daily has.
Support on the weekly chart holds near $0.06734, with deeper support at $0.04620.
Whale Wallets and Holder Concentration
This is where things get less exciting and more cautionary. On-chain data shows the top 10 wallets hold 90.21% of supply, worth roughly $128.97M. Whale wallets alone account for 89.54% of tokens despite making up just 0.004% of all holders. Twenty-seven whale wallets control 73.6% of the total supply between them.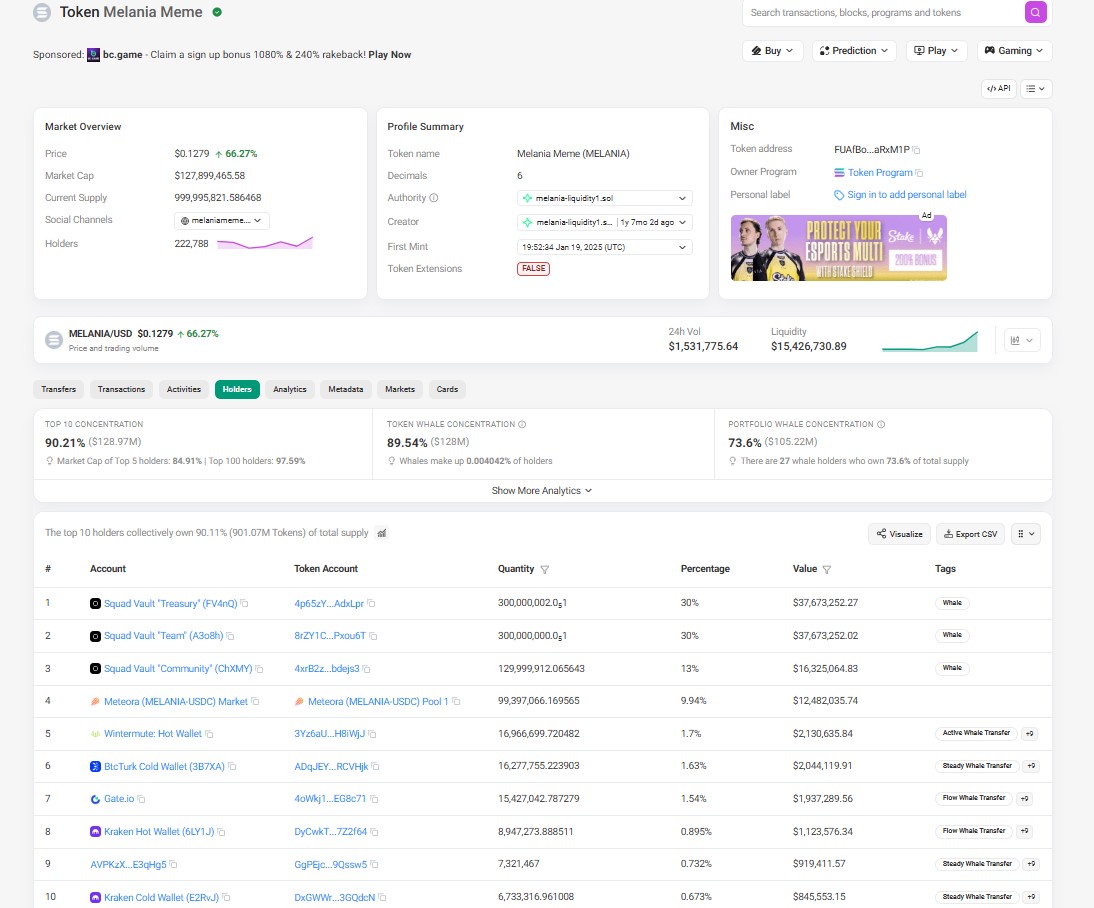
Breaking down the categories matters here. The largest holder is a treasury squad vault at 30%, followed closely by a team vault, also at 30%.
A community vault holds 13%, and a Meteora liquidity pool accounts for 9.94%. Exchange-linked wallets like Wintermute, BtcTurk, Gate.io, and Kraken make up the rest of the top ten, each under 2%. That's a heavily insider-weighted structure. It doesn't guarantee a dump, but it does mean supply overhang risk is real.
Several of those exchange wallets are worth watching separately, since new venue support can shift liquidity fast; the exchange listing news feed tracks that in real time.
Liquidations and Trading Volume Across Exchanges
Breaking: According to CoinGlass, leveraged traders got hit hard on this move. Over the past 24 hours, $764.56K in positions got liquidated, split between $358.48K in longs and $406.08K in shorts. The 12-hour window alone saw $741.59K wiped out. Shorts took the bigger hit late, a sign the breakout caught bears off guard.
Spot volume tells a similar concentration story. Binance alone processed $47.20M, dwarfing LBank's $16.90M and Bybit's $7.81M. Bitget, WhiteBIT, Gate, and Hyperliquid split the remainder in smaller chunks. Volume this concentrated on one venue means price discovery is largely happening in one place, which can amplify moves in either direction.
For scale, it helps to compare against the market leader; Bitcoin's latest price coverage shows how much calmer large-cap liquidation activity looks by comparison.
Memecoin Momentum: Why MELANIA Trades Differently
MELANIA behaves like a memecoin first and a fundamental asset a distant second. That's not a criticism; it's just how this category works. Price here responds to attention, liquidity depth, and social momentum far more than to product updates. And that cuts both ways. Upside can be explosive on thin volume, but downside can move just as fast once buying dries up.
For broader context on how this token category is trending right now, the latest memecoin market coverage tracks similar breakout patterns across the sector.
Some memecoin rallies also tie back to reward campaigns rather than pure speculation; the current token airdrop listings are worth a scan if that's part of what's driving fresh wallets into tokens like this one.
Official Melania Meme Price Prediction: Bear, Base, and Bull Scenarios
Timeframe | Bear Case | Base Case | Bull Case | Probability | Invalidation |
7 Days | $0.085 | $0.13 | $0.165 | Bear 30% / Base 45% / Bull 25% | Close below $0.08 |
30 Days | $0.065 | $0.14 | $0.195 | Bear 30% / Base 40% / Bull 30% | Trades below $0.0659 |
Early 2027 | $0.045 | $0.16 | $0.29 | Bear 25% / Base 40% / Bull 35% | Weekly trades below $0.0462 |
This Official Melania Meme price prediction is scenario-based, not a guarantee. Probabilities reflect current technical structure and whale concentration risk, not certainty.
Key Risks Behind This Forecast
Whale concentration remains the biggest overhang; a single treasury or team vault unlocking meaningfully would pressure price fast. Overbought daily RSI raises short-term pullback odds. Liquidity, while decent at 11.41% of market cap, is still thin enough for large orders to cause slippage. And leverage-driven liquidation cascades, as seen in the past 24 hours, can exaggerate both rallies and drops.
Broader macro catalysts matter too. Readers should watch how Federal Reserve policy shifts could shift risk appetite across the entire memecoin sector, MELANIA included.
There's also a Senate-side angle to this story; the Senate crypto bill vote could move sentiment across risk assets broadly, memecoins included.
Disclaimer
This article is for informational purposes only and does not constitute financial, investment, or trading advice. Cryptocurrency markets, and memecoins in particular, are highly volatile. Prices referenced were accurate as of August 22, 2026, around 14:00 UTC, and may have changed since publication. Always do your own research and consult a licensed financial advisor before making investment decisions.
Also read:











.webp)





