Official Trump Price Prediction: $4M Wiped Out in Brutal Reversal


The official Trump price prediction has to start with what just happened on the chart, because $TRUMP didn't just pull back quietly; it got shaken hard.
The token launched as a politically themed meme coin and quickly became one of the more heavily traded names in that category, drawing both fast money and fast liquidations in equal measure.
$TRUMP is currently trading at $2.386, down 0.3% on the day, after breaking out of a descending channel earlier this week and then getting rejected on the retest.
Official Trump Live Market Data
Metric | Value |
Price | $2.386 |
24h Change | -0.3% |
24h Range | $2.22 - $2.45 |
Market Cap | $623.298M |
Fully Diluted Valuation | $2.38B |
24h Trading Volume | $346.378M |
Circulating Supply | 261.881M |
Total Supply / Max Supply | 1B |
Official Trump Exchange Volume
Binance leads $TRUMP trading with $249.20M in 24-hour volume, followed closely by OKX at $224.52M.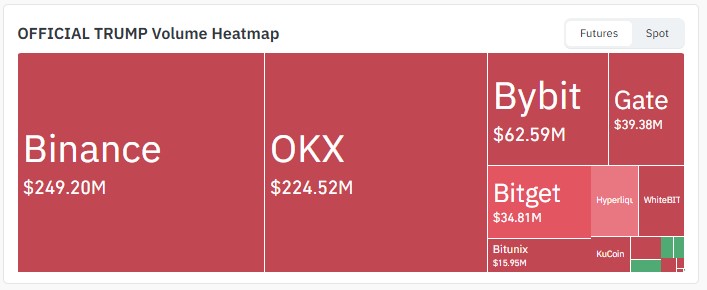
Source: Volume Heatmap Data Taken From CoinGlass, As of Sep 5, 2026
Bybit comes in next at $62.59M, then Gate at $39.38M and Bitget at $34.81M.
Bitunix, WhiteBIT, and KuCoin round things out with smaller contributions, none of which shift the overall picture. Binance and OKX are carrying this move almost entirely.
Official Trump Liquidation Data
Timeframe | Total Liquidated | Longs | Shorts |
1h | $32.66K | $31.73K | $931.57 |
4h | $550.13K | $111.61K | $438.51K |
12h | $853.56K | $271.44K | $582.12K |
24h | $4.10M | $3.41M | $684.05K |
Over 24 hours, longs took the far bigger hit, losing $3.41M against just $684.05K on the short side.
That's a lopsided ratio, and it points to a lot of leveraged buyers getting caught on the wrong side of this reversal.
Zoom into the last hour, though, and shorts are the ones bleeding, which tracks with how choppy this move has been in both directions.
Official Trump Price Prediction Outlook: Technical Analysis
The 4-hour TRUMP/USDT chart on Binance shows the price breaking out of a descending channel it had been stuck in for over a week.
That breakout carried real momentum, pushing $TRUMP well above its EMAs before sellers stepped back in hard.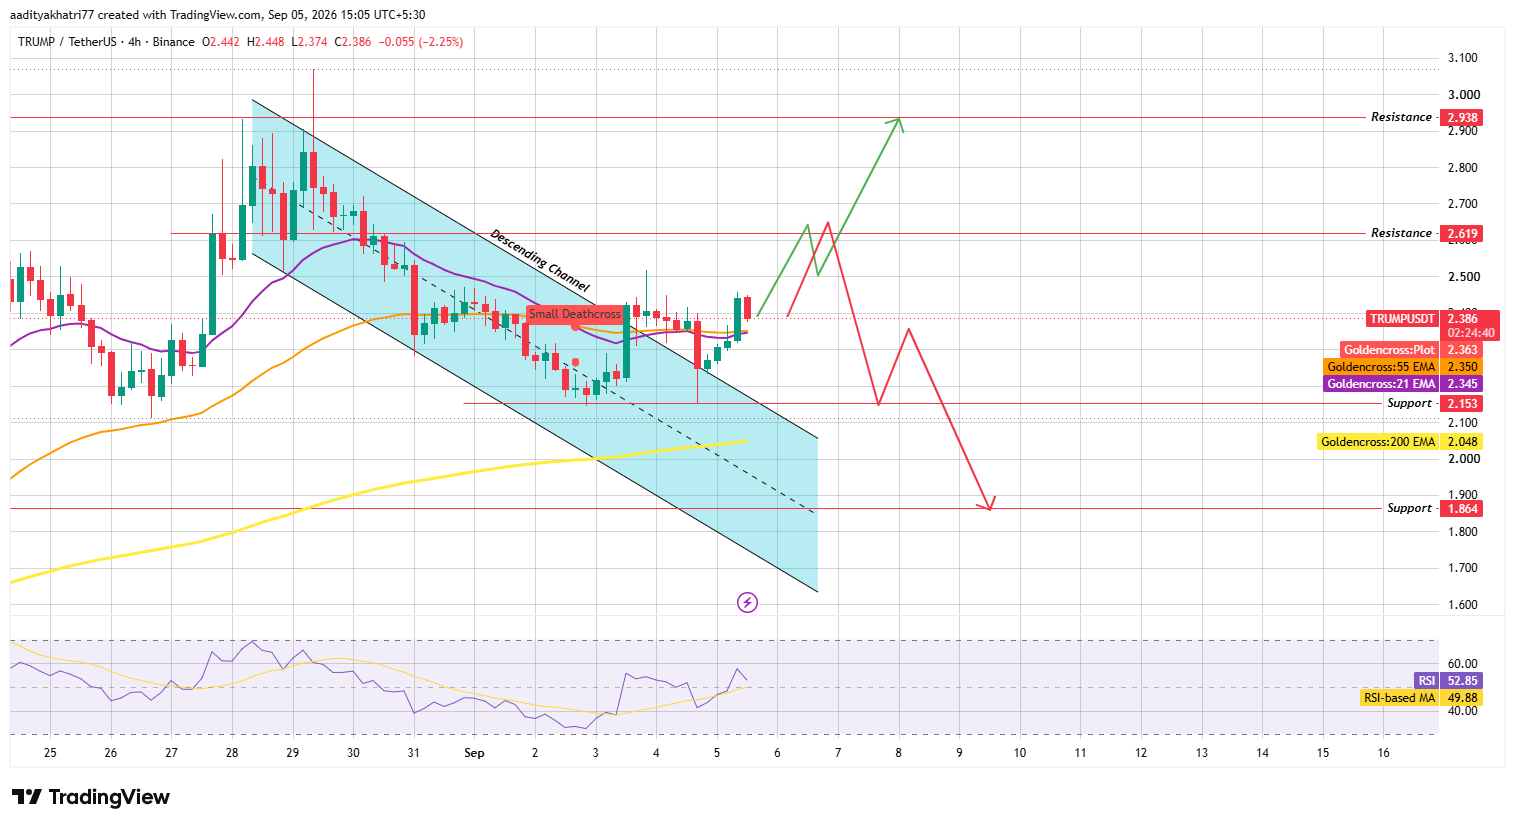
Source: Chart Taken From TradingView, As of Sep 5, 2026
Right now, price has pulled back and is sitting just above those EMA levels, essentially retesting the zone it broke out from.
Can $TRUMP Push Toward Higher Resistance?
For bulls to keep control here, $TRUMP needs to hold this retest and stay above the 21 EMA at $2.345.
Manage that, and becomes $2.619 the first real level, with $2.938 as the extended goal if buying volume shows up in size.
What Happens If $TRUMP Loses This Support Zone?
If the retest fails and the price closes back below the current EMA cluster on real volume, the setup turns less friendly fast.
The next real support sits at $2.153. Lose that too, and the slide could extend toward $1.864, which lines up with a deeper support zone from earlier price action.
RSI is reading 52.85 against an RSI-based moving average of 49.88, right around neutral. Momentum isn't screaming in either direction yet, which fits a market still deciding what this retest actually means.
Official Trump Support and Resistance Levels (4H Chart)
Level Type | Price |
Resistance 2 | $2.938 |
Resistance 1 | $2.619 |
Support 1 | $2.153 |
Support 2 | $1.864 |
EMA | Price | Price Position |
21 EMA | $2.345 | Price trading above |
55 EMA | $2.350 | Price trading above |
Official Trump Price Prediction: Bull, Base, and Bear Scenarios
Scenario | Setup | Level |
Bull Case | Retest holds, price stays above the 21 EMA with volume support | $2.619, then $2.938 |
Base Case | Price chops around the current retest zone without a clear break. | Range-bound between $2.20 and $2.45 |
Bear Case | Retest fails, price closes back below the EMA cluster | $2,153, with risk toward $1,864 |
Descending Channel: Two parallel trendlines sloping downward, boxing price in until it breaks out one way or the other.
EMA (Exponential Moving Average): Weighs recent price action more heavily than older data, making it quicker to react to fresh momentum.
RSI (Relative Strength Index): A 0-100 momentum gauge tracking how fast and how far price has moved, used to flag overbought or oversold conditions.
Liquidation: When an exchange force-closes a leveraged position because there isn't enough margin left to cover the loss.
Support Zone: A price area where buyers have historically stepped in and stopped declines.
Resistance Zone: A level where sellers have previously capped a rally.
Official Trump vs Bitcoin
$TRUMP's breakout and reversal both look tied to its own chart structure rather than anything happening with Bitcoin specifically.
That said, meme and politically themed coins like $TRUMP tend to amplify whatever Bitcoin price today does, moving further in both directions when Bitcoin trends one way.
Bitcoin's order book carries more depth and long-term holder support, so its key levels tend to hold more predictably than TRUMP's, where retail leverage drives sharp swings like the $4.10M liquidation figure seen here.
If Bitcoin holds firm, $TRUMP likely gets an easier path toward $2.619. If Bitcoin turns lower, this retest could fail faster and harder than Bitcoin's own pullback.
Expert Opinion
Market watchers following $TRUMP's breakout note that clearing the descending channel was a genuinely bullish technical signal, but the size of the liquidation wave on the reversal suggests the move got ahead of itself.
Whether TRUMP holds this retest above its EMAs is the level worth watching over the next session or two, since that's likely to determine whether $2.619 comes into play or whether this turns into a deeper pullback toward $2.153.
Disclaimer: This official Trump price prediction is based on technical chart analysis and current market data and should not be treated as financial advice. Cryptocurrency markets are highly volatile, and actual price movements may deviate significantly from projected scenarios. Support and resistance levels discussed represent probability zones, not guaranteed outcomes, and downside risk exists at every stage of this analysis. Readers should conduct independent research before making investment decisions.
Also read:

















