PAX Gold Price Prediction: Will $PAXG Hit New All-Time High, Upcoming?


PAX Gold is a tokenized commodity backed one-to-one by physical gold held in Brink's vaults, with each PAXG token representing one fine troy ounce of London Good Delivery gold.
The token functions as an on-chain way to hold and transfer gold exposure without directly managing physical bullion.
This PAX Gold Price Prediction looks at whether PAXG's recent consolidation area can resolve into a breakout, based on current chart structure, liquidation activity, and holder data. Here's what the numbers show.
Market data checked on August 5, 2026, at 15:04 IST.
PAX Gold Price Prediction Today: Market Overview
Metric | Value |
Price | $4,146.59 |
24h Change | +2.01% |
Market Cap | $1.83B |
FDV | $1.83B |
24h Volume | $183.0M+ |
Vol/Mkt Cap (24h) | 9.92% |
Liq/Mkt Cap | 1.03% |
Total Supply | 441.92K PAXG |
Max Supply | Uncapped |
Circulating Supply | 441.92K $PAXG |
Holders | 85.33K |
Source: Data from CoinMarketCap as of August 5, 2026, at 15:04 IST.
Figures may vary slightly across other tracking websites.
$PAXG Liquidation and Volume Data
Futures liquidation and exchange volume figures below are sourced from Coinglass and are kept separate from the spot volume referenced above.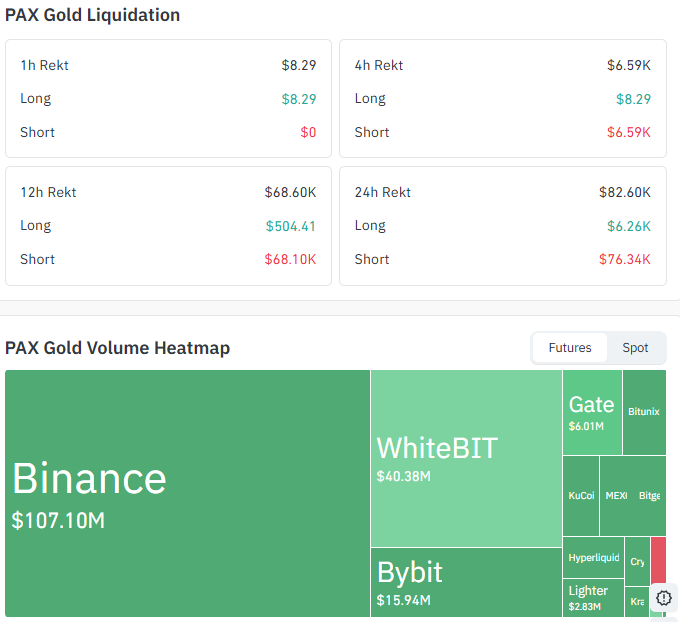
Source: Data From CoinGlass
Window | Total Rekt | Long | Short |
1h | $8.29 | $8.29 | $0 |
4h | $6.59K | $8.29 | $6.59K |
12h | $68.60K | $504.41 | $68.10K |
24h | $82.60K | $6.26K | $76.34K |
Short liquidations dominate almost every window, with barely any long liquidations recorded across the full 24 hours, showing shorts have been squeezed consistently as PAXG pushed toward the top of its recent range.
Futures Exchange Volume
Exchange | Volume |
Binance | $107.10M |
WhiteBIT | $40.38M |
Bybit | $15.94M |
Gate | $6.01M |
Lighter | $2.83M |
Binance accounts for well over half of the visible futures volume, with WhiteBIT a distant second, showing activity concentrated on a handful of venues.
PAX Gold Holder Distribution
Holder concentration on PAXG sits at a more moderate level than many altcoins. The top 100 wallets control 56.87% of total supply, and whales (2.03% of all holders) hold 86.44% of market cap, giving a Gini score of 0.9773. 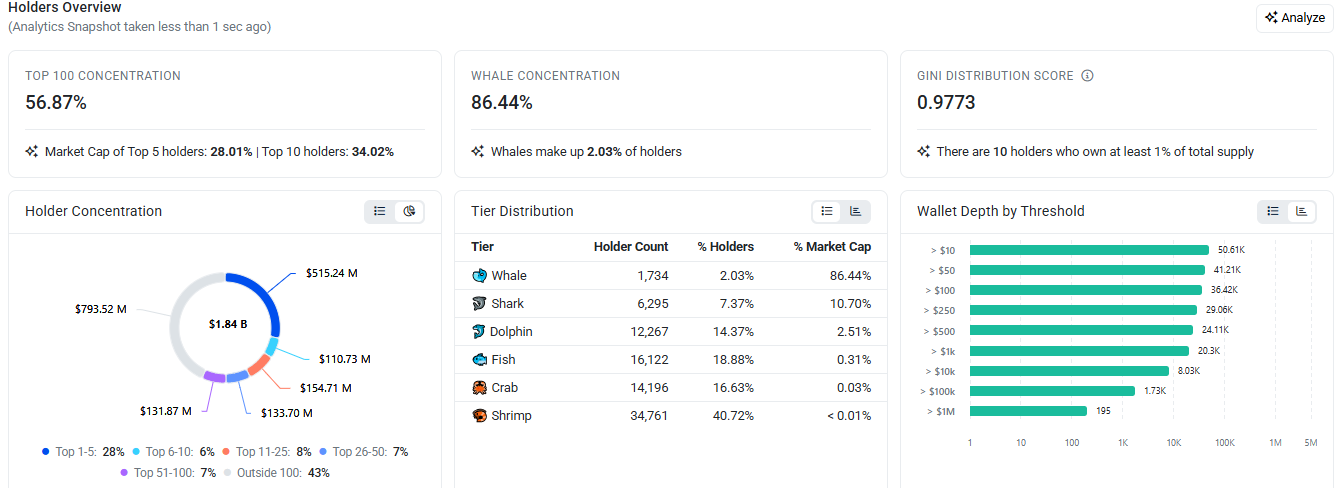
Just 10 wallets hold at least 1% of total supply each, with the top 5 wallets alone accounting for 28% of market cap.
Tier | Holder Count | % Holders | % Market Cap |
Whale | 1,734 | 2.03% | 86.44% |
Shark | 6,295 | 7.37% | 10.70% |
Dolphin | 12,267 | 14.37% | 2.51% |
Fish | 16,122 | 18.88% | 0.31% |
Crab | 14,196 | 16.63% | 0.03% |
Shrimp | 34,761 | 40.72% | <0.01% |
This concentration means large-wallet movement can still influence price meaningfully, though PAXG's gold backing tends to anchor its value more than typical altcoin supply-demand dynamics.
PAXG Price Prediction Chart: Technical Analysis
Pair: PAX Gold/USD · Market: Spot (Crypto) · Timeframe: 1D · Source: TradingView · Timestamp: August 5, 2026, 15:04 UTC+5:30
PAXG is trading at $4,146.59, after a sharp decline from May-June highs near $4,700 gave way to a consolidation range that has held since mid-July.
Price has spent recent weeks trading inside this consolidation range and has just pushed toward the upper boundary.
The EMA 20 (Exponential Moving Average, a momentum indicator that weights recent candles more heavily, kept separate from the horizontal levels below) sits at $4,068.50, with the EMA 50 close behind at $4,122.02, both now below current price and sitting inside the consolidation range as near-term support.
RSI (14) reads 58.22, in neutral-to-mildly-bullish territory, consistent with a range-bound market testing its upper edge rather than showing strong directional momentum in either direction.
Important levels for range breakout.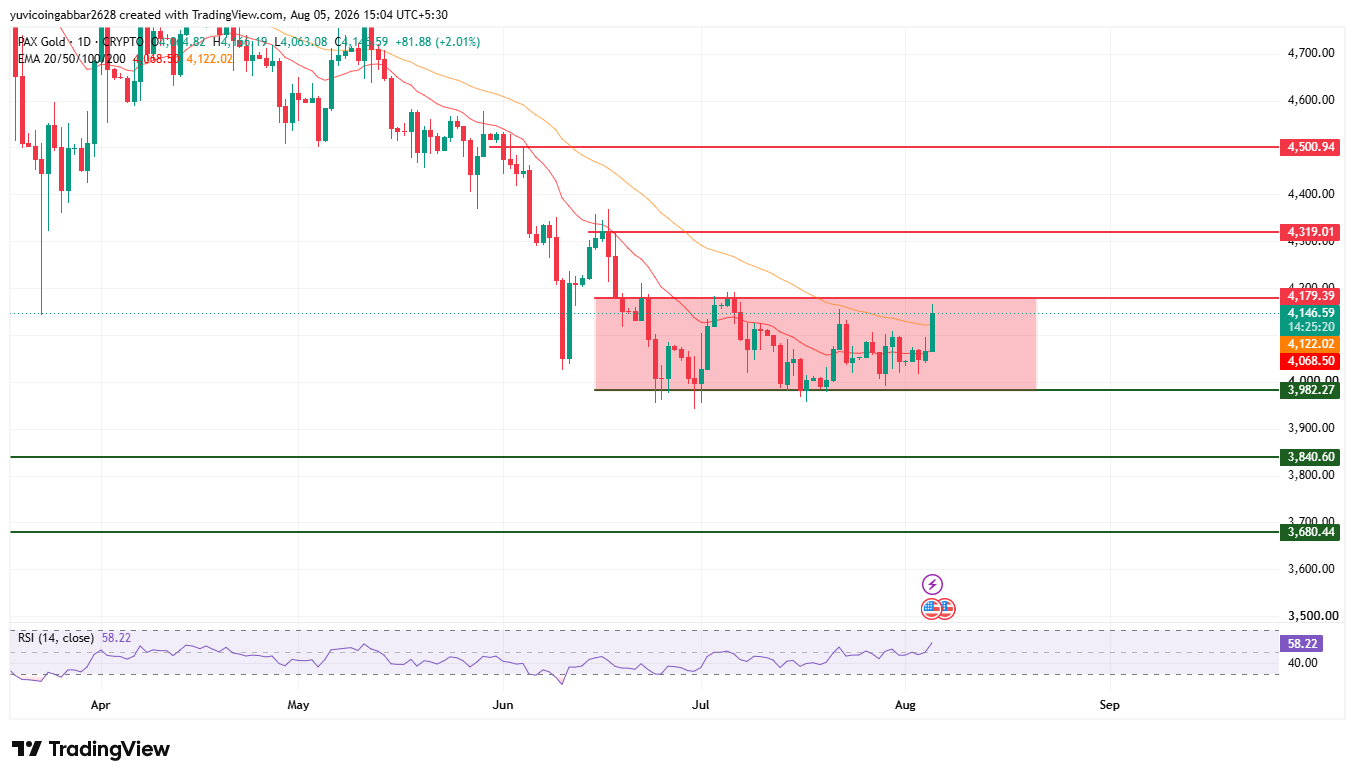
Support and Resistance Levels
Level Type | Price |
Resistance 3 | $4,500.94 |
Resistance 2 | $4,319.01 |
Resistance 1 (nearest, range top) | $4,179.39 |
Immediate Price Reference | $4,146.59 |
First Support (range bottom) | $3,982.27 |
Deeper Support | $3,840.60 |
Structural Floor | $3,680.44 |
EMA Levels
EMA | Price |
EMA 20 | $4,068.50 |
EMA 50 | $4,122.02 |
PAX Gold Forecast: Bull Case vs. Bear Case
Bull case: Holding above the EMA cluster near $4,068.50 to $4,122.02 and the first confirmed support at $3,982.27 keeps PAXG positioned to test the top of its consolidation range.
A confirmed close above the nearest resistance at $4,179.39 would open the path toward $4,319.01 and eventually $4,500.94.
Bear case: A rejection at $4,179.39 followed by a break below the EMA cluster and the first confirmed support at $3,982.27 would suggest the range is resolving lower rather than higher.
Losing $3,840.60 would expose the structural floor at $3,680.44.
Can PAXG Reach $4,500.94?
$4,500.94 is the highest resistance level marked on the chart. Reaching it would require PAXG to first clear the range top at $4,179.39, then hold above $4,319.01, a multi-stage move that would need the current consolidation to break decisively to the upside rather than a single push higher.
What Could Invalidate the Bullish Setup?
A rejection at the nearest resistance near $4,179.39 followed by a close back below the EMA cluster and the first confirmed support at $3,982.27 would put the range-breakout case in doubt.
A deeper break below $3,840.60 and the structural floor at $3,680.44 would confirm the range is resolving to the downside.
PAX Gold Price Prediction 2026: Expert View
According to CoinGabbar analysts, The liquidation data shows a consistent short squeeze pattern across every window, with almost no long liquidations recorded even over the full 24 hours, indicating shorts have been under sustained pressure as PAXG pushed toward the top of its range. 
Futures volume is concentrated heavily on Binance, which handles well over half of visible activity, with WhiteBIT a distant second. Holder concentration remains high, with the top 100 wallets controlling 56.87% of supply, though this is notably lower than typical altcoin concentration levels, consistent with PAXG functioning more as a tokenized commodity than a speculative token.
The $3,982.27 to $4,179.39 range is the zone to watch most closely: a decisive break in either direction would likely set the tone for the next multi-week move.
PAX Gold Price Prediction: Data Sources
Price and EMA data referenced from a 1D PAX Gold/USD chart via TradingView, timestamped August 5, 2026, 15:04 UTC+5:30. Market cap, FDV, volume, and supply data referenced from CoinMarketCap. Liquidation and exchange volume data referenced from Coinglass. Holder concentration data referenced from on-chain holder analytics.
Disclaimer: This piece is for informational purposes only and isn't financial advice. The levels and scenarios above are based on technical chart analysis and publicly available data at the time of writing, and crypto markets can move sharply within hours, so past patterns don't guarantee future outcomes. It's worth doing independent research and considering your own risk tolerance before acting on any of the levels discussed here.


















