PAX Gold Price Prediction: $PAXG All Time-High, Key Levels?


Gold-backed PAXG keeps grinding higher, and holders are watching closely.
Price is sitting near record territory again, volume has spiked hard, and shorts are getting squeezed on every timeframe.
This PAX Gold Price Prediction looks at whether this steady climb has more room or if it's due for a pause.
Market data was checked on August 24, 2026, at 16:30 IST.
PAX Gold Price Prediction Today: Market Overview
Metric | Value |
Price | $4,636.20 |
24h Change | +0.97% |
Market Cap | $2B (+0.97%) |
FDV | $2B |
24h Volume | $221M (+197.96%) |
Vol/Mkt Cap (24h) | 11.01% |
Liquidity/Mkt Cap | 1.10% |
Total Supply | 433.3K PAXG |
Max Supply | Infinite |
Circulating Supply | 433.3K PAXG |
Holders | 86.17K |
Source: Data from CoinMarketCap as of August 24, 2026, at 16:30 IST. Figures may vary slightly across other tracking websites.
PAX Gold Liquidation and Volume Data (Coinglass)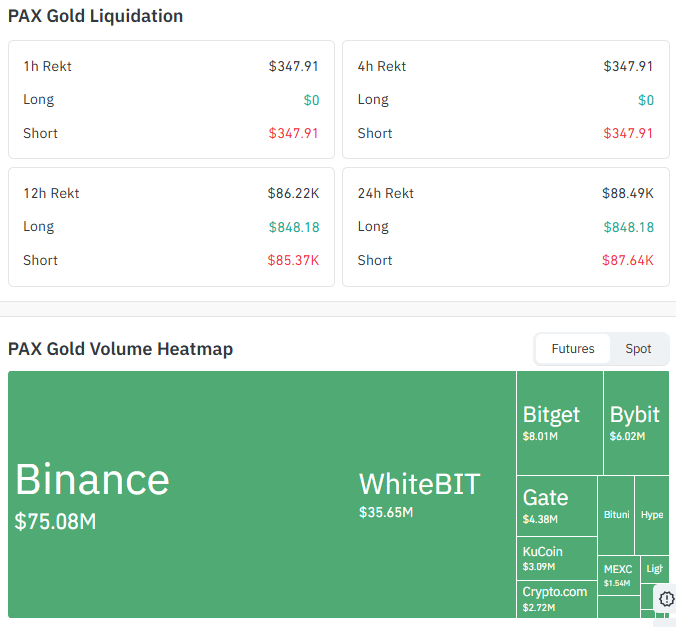
Source: Data From CoinGlass
PAXG liquidations (futures data): 1h—$347.91, entirely short-side; 4h—$347.91, also entirely short-side; 12h—848.18 long, $85.37K short; 24h—848.18 long, $87.64K short.
Shorts have absorbed nearly all the damage across every window, a sign of continued upward pressure.
Futures volume is led by Binance at $75.08M, followed by WhiteBIT at $35.65M, Bitget at $8.01M, and Bybit at $6.02M, with smaller volume spread across Gate, KuCoin, Crypto.com, and MEXC.
What Is PAX Gold (PAXG)?
PAX Gold is a token backed one-to-one by physical $gold, with each PAXG representing one fine troy ounce of London Good Delivery gold held in vaults by Paxos.
It gives holders on-chain exposure to gold's price without needing to store or manage physical bullion themselves.
$PAX Gold Price Prediction Chart: Key Levels 2026
Pair: PAX Gold/USD · Market: Spot (Crypto) · Timeframe: 1D · Source: TradingView · Timestamp: August 24, 2026, 16:30 UTC+5:30
$PAXG is trading at $4,636.20, with RSI reading 73.30, in overbought territory after the recent climb.
Level Type | Price |
Resistance 3 | $4,759.36 |
Resistance 2 | $4,707.10 |
Resistance 1 (nearest) | $4,652.56 |
Immediate Price Reference | $4,636.20 |
First Support | $4,584.39 |
Deeper Support | $4,559.39 |
PAX $Gold Forecast: Bull Case vs. Bear Case
Bull case: Holding above $4,584.39 keeps the uptrend intact. A close above $4,652.56 opens the path toward $4,707.10 and eventually $4,759.36.
Bear case: An RSI above 73 leaves PAXG exposed to a pullback. Losing $4,584.39 would put the rally in doubt, with $4,559.39 as the next support.
Here are a few solid additions you can drop into the PAXG article:
PAXG Long-Term Price Prediction (2026–2030)
Period | Price Range | Notes |
2026–2027 | $4,600 – $5,200 | Grounded in current chart resistance levels |
2027–2028 | $5,200 – $6,000 | Depends on continued $gold demand and DeFi adoption |
2028–2030 | $6,000 – $8,000 | Speculative; realistic only in a sustained broader $gold and crypto uptrend |
Long-term figures beyond 2027 are speculative and not based on current chart levels.
Why Gold-Backed Tokens Are in Demand Right Now
Tokenized $gold has been picking up interest as investors look for a safe-haven asset that also trades 24/7 like crypto.
PAXG gives holders exposure to physical $gold prices without needing to store or insure actual bars, which is part of why volume has been climbing alongside broader $gold strength.
PAX $Gold Price Prediction: Expert View
According to CoinGabbar analysts, PAXG's climb is backed by real liquidation flow, with shorts getting squeezed across nearly every timeframe rather than the move being driven by hype alone.
Still, an RSI above 73 means the rally is stretched, so a pause toward $4,584.39 wouldn't be surprising.
The $4,584.39 to $4,652.56 range is the zone to watch: holding it keeps the trend alive, while a clean break above $4,652.56 opens room toward $4,759.36.
Disclaimer: This piece is for informational purposes only and isn't financial advice. The levels and scenarios above are based on technical chart analysis and publicly available data at the time of writing, and crypto markets can move sharply within hours, so past patterns don't guarantee future outcomes. It's worth doing independent research and considering your own risk tolerance before acting on any of the levels discussed here.

















