PAX Gold Price Prediction: $PAXG Long-Term Chart Analysis, What Next?


PAX Gold Price Right Now: The Numbers That Matter. PAXG is pulling back from its recent highs, and gold-backed token holders are watching closely to see if the pullback turns into something bigger.
This PAX Gold Price Prediction looks at whether the current support zone holds or whether PAXG has further room to fall before the next leg forms.
Market data was checked on August 19, 2026, at 14:33 IST.
PAX Gold Price Right Now: The Numbers That Matter
Metric | Value |
Price | $4,352.07 |
24h Change | -1% |
Market Cap | $1.9B |
FDV | $1.9B |
24h Volume | $189.5M |
Vol/Mkt Cap (24h) | 9.96% |
Liq/Mkt Cap | 1.02% |
Total Supply | 436.94K $PAXG |
Max Supply | ∞ (uncapped) |
Circulating Supply | 436.94K $PAXG |
Holders | 86.29K |
Source: Data from CoinMarketCap as of August 19, 2026, at 14:33 IST. Figures may vary slightly across other tracking websites.
Inside PAXG's Liquidation Data: Who's Getting Hurt in the Pullback
Timeframe | Total | Long | Short |
1h | $8.72 | $0 | $8.72 |
4h | $100.34 | $0 | $100.34 |
12h | $40.51K | $40.12K | $395.92 |
24h | $63.78K | $63.15K | $633.22 |
Almost every dollar liquidated in the past 24 hours came from long positions, per Coinglass futures data, with $63.15K of the $63.78K wiped out belonging to longs against just $633.22 on the short side. 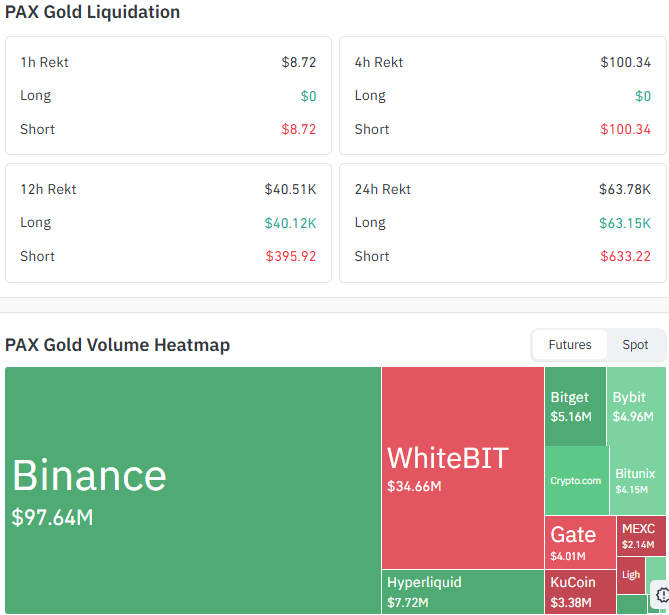
Source: Data From CoinGlass
The pattern flipped within the day too; the 1h and 4h windows show only shorts getting liquidated, while the 12h and 24h windows are almost entirely long liquidations, mirroring the shift from the recent rally into the current pullback.
This is futures-specific data and separate from the spot volume in the market overview above.
Futures Volume by Exchange
Exchange | 24h Volume |
Binance | $97.64M |
WhiteBIT | $34.66M |
Binance leads futures volume with $97.64M, but WhiteBIT's $34.66M stands out as unusually high for the exchange, suggesting a concentration of flow there worth watching alongside Binance's dominant share.
Reading the PAXG Chart: Advanced Technical Market Analysis
Pair: PAXG/USD · Market: Spot (Crypto) · Timeframe: 1W · Source: TradingView · Timestamp: August 19, 2026, 14:33 UTC+5:30
PAXG rallied hard into 2026 before hitting out near $5,566.91 and pulling back into a multi-week drop.
Price is now sitting right at the 0.618 Fibonacci support near $4,313.52, the level to watch most closely here.
If the price holds this level, it could move higher.
A confirmed break below it would shift focus to the deeper 0.5 support at $3,926.35, which is the key floor for this pullback.
The EMA (Exponential Moving Average) cluster sits just below the current price, with the 20-period EMA at $4,325.68 and the 50-period EMA at $4,226.02, both offering nearby support if the 0.618 level gives way.
PAXG's weekly RSI sits at 50.42, dead neutral. It shows no strong bias either way, consistent with a market pausing at support rather than breaking down hard.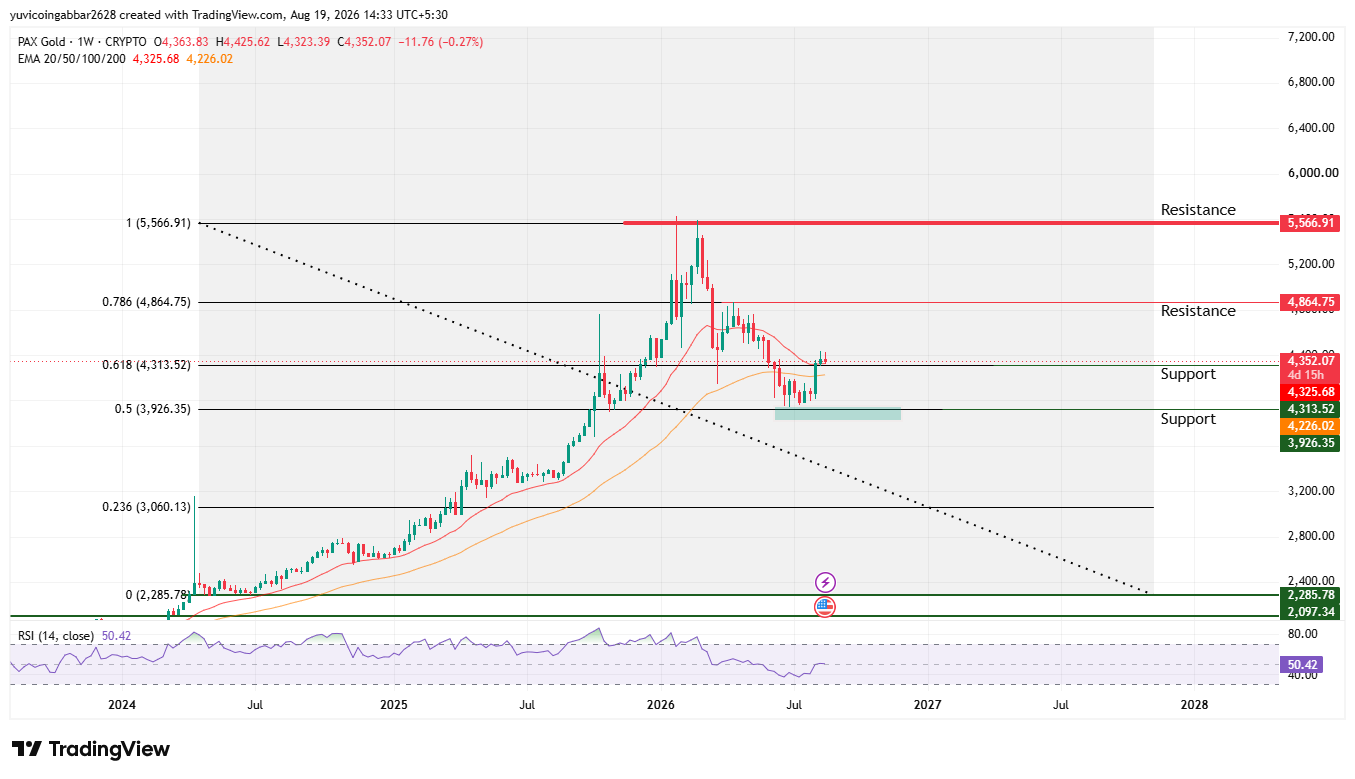
PAXG Advanced Price Analysis: Key Levels to Watch
Level Type | Price |
Resistance 2 | $5,566.91 |
Resistance 1 | $4,864.75 |
Immediate Price Reference | $4,352.07 |
First Support (0.618 Fib) | $4,313.52 |
Deeper Support (0.5 Fib) | $3,926.35 |
$PAXG Market Trend and Momentum Signals
EMA | Price |
EMA 20 | $4,325.68 |
EMA 50 | $4,226.02 |
$PAXG Price Prediction: Bull Case vs Bear Case Breakdown
$PAXG price target 2026 Bull case: Holding the $4,313.52 support and the EMA cluster near $4,226.02 to $4,325.68 would keep this a healthy pullback.
A recovery above $4,864.75 would put the prior highs near $5,566.91 back in view.
$PAXG price target 2026 Bear case: Losing $4,313.52 would open a slide toward the $3,926.35 support, the more important floor on this chart.
A break there would suggest the 2026 rally is due for a deeper correction.
PAXG Price Scenarios: What Could Happen Next
Scenario | Trigger | Likely Outcome | Invalidation Point |
Support hold / bullish | Hold above $4,313.52 | Move toward $4,864.75 & $5,566.91 | Close below $4,313.52 |
Range consolidation | Price stays between $4,313.52 and $4,500 | Sideways chop | Break of either boundary |
Breakdown / bearish | Close below $4,313.52 | Deeper correction, next $3,926.35 | Reclaim of $3,926.35 |
Can PAXG Reach $5,566.91?
$5,566.91 is the highest resistance marked on the chart, PAXG's recent 2026 high.
Getting back there would require holding current support, reclaiming the EMA cluster, and then clearing $4,864.75 first.
PAX Gold Price Prediction: What the Data Is Really Saying
According to CoinGabbar analysts, PAXG's pullback looks orderly so far, with the price testing the 0.618 support right where the EMAs sit close by.
The one-sided long liquidations over the past 24 hours suggest leveraged buyers got caught off guard by the drop, but the muted overall size keeps this from looking like panic.
RSI at 50.42 shows no stress in this move either.
The $4,313.52 level is the one that actually matters most here a break below it would be the first real sign the broader uptrend is under pressure, while holding above $3,926.35 keeps the recovery case intact.
Disclaimer: This piece is for informational purposes only and isn't financial advice. The levels and scenarios above are based on technical chart analysis and publicly available data at the time of writing, and crypto markets can move sharply within hours, so past patterns don't guarantee future outcomes. It's worth doing independent research and considering your own risk tolerance before acting on any of the levels discussed here.







.webp)








