Solana Price Prediction: Can $SOL Ride ETF Hype to $119?

Solana has grown from a niche smart contract chain into one of the most actively traded assets in crypto, known for its speed and its ability to handle massive transaction volumes without breaking a sweat.
In this Solana Price Prediction, $SOL is currently trading around $101.59, down 3.3 percent on the day, with traders watching closely to see whether the dip is just a pause inside the broader uptrend or the start of a deeper pullback.
The coin has come a long way since its 2020 launch, growing from an early smart contract experiment into a top ten asset by market cap, and this month looks just as eventful for anyone following a Solana price prediction.
Live Market Data
Metric | Value |
Price | $101.59 (-3.3%) |
24h Range | $100.62 to $107.35 |
Market Cap | $59.474B |
Fully Diluted Valuation | $64.358B |
24h Trading Volume | $3.172B |
Circulating Supply | 585.121M |
Total Supply | 633.173M |
Max Supply | Infinite |
Source: $Sol market cap data taken from Coingecko, data as of Aug 31, 2026. Figures may vary slightly across other tracking websites.
Exchange Volume
Trading activity remains heavily concentrated on Binance, which handled roughly $2.56B in Solana futures volume, well ahead of OKX at $1.31B and MEXC at $1.23B. 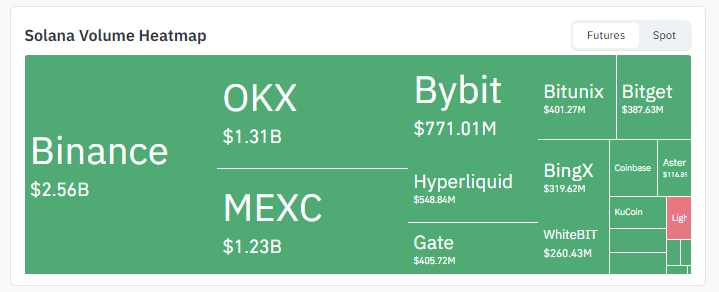
Source: Volume Heatmap Data Taken From Coinglass.
Bybit and Hyperliquid also carry meaningful volume at $771.01M and $548.84M, respectively, showing that liquidity for $SOL is spread across a wide mix of centralized and decentralized prediction rather than sitting in one place.
Liquidation Snapshot
Liquidation data over the past 24 hours tells an interesting story for this $SOl Price Prediction.
Roughly $29.46M in total positions were wiped out, and the damage was lopsided, with $24.73M coming from long positions against just $4.74M in shorts. 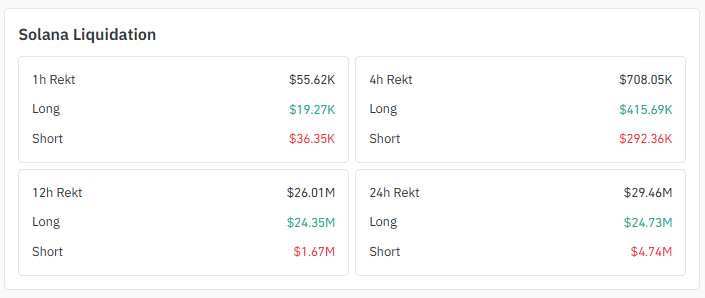
Source: Liquidation Data Taken From Coinglass.
Zooming into the shorter 4-hour window, $708.05K was liquidated, again skewed toward longs at $415.69K versus $292.36K in shorts.
That kind of imbalance usually points to overleveraged buyers getting caught by a short-term dip, which can sometimes clear the way for a healthier move higher once the excess leverage is flushed out.
Solana News Today
The community mood around Solana has been upbeat lately, and it shows in the chatter online.
One widely shared post pointed out that Solana's spot trading volume outpaced the NYSE American last week, a comparison that quickly caught fire among traders looking for validation of the network's growing relevance and feeding right into this Solana price prediction.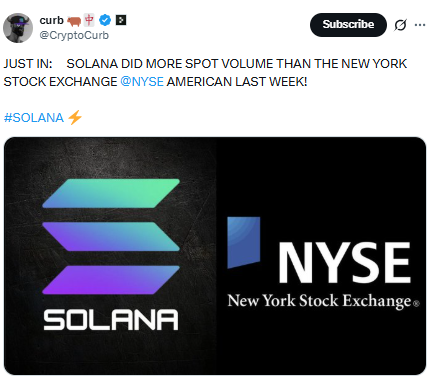
Source: Data Taken From @CryptoCurb, X Account.
Another popular thread compared transaction speeds across major chains, showing Solana processing roughly 2,124 transactions per second, far ahead of BNB, Tron, Base, and Ethereum. 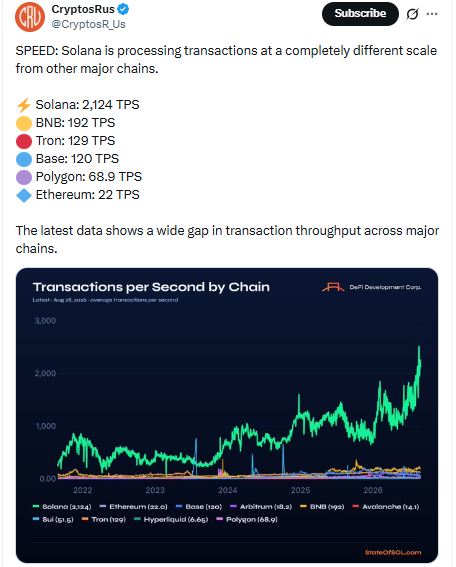
Source: Data Taken From @CryptosR_US, X Account.
Solana's own account also recapped a busy week, noting that its first binding on-chain governance vote had closed with the network coming out 25 percent faster as a result. 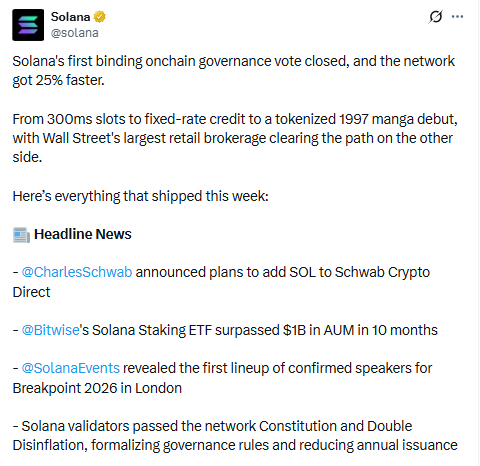
Source: Data Taken From @solana, X Account.
The same recap flagged Charles Schwab's plan to bring SOL to its Crypto Direct platform and Bitwise's Solana Staking ETF crossing $1B in assets in under ten months, both fresh tailwinds for this Solana price prediction.
Key Takeaways
SOL is trading near $101, sitting close to the lower boundary of a 4-hour ascending channel that has guided price since late August.
A confirmed break above the $109.96 resistance could open the door toward $119.13, a level the Wolfe Wave structure on the chart also points to.
Losing the channel's lower trendline near $101 and the $94.46 support could send SOL toward $87.68.
Solana processed more spot volume than the NYSE American last week, and Schwab's move to add SOL to its Crypto Direct platform is adding fresh fuel to the Solana Price Prediction narrative.
24-hour liquidation data shows longs took the bigger hit, losing $24.73M against just $4.74M in short liquidations, hinting at a shakeout before the next leg.
Technical Analysis
Zooming into the 4-hour chart, SOL is riding inside a clean ascending channel that has been intact since late August.
Price is currently sitting close to the lower rail of that channel, a spot that has acted as a launchpad for bounces on more than one occasion this cycle. 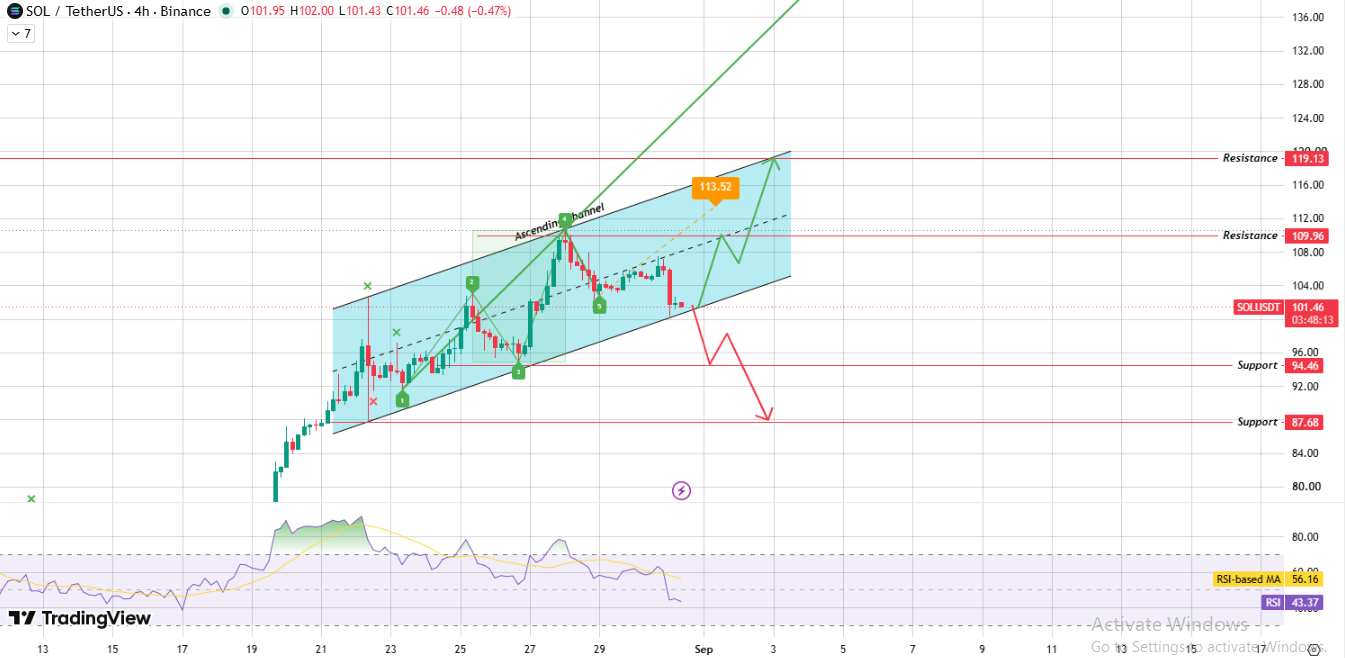
Source: Chart Taken From TradingView.
RSI is reading 43.37, below its own moving average of 56.16, which tells us momentum has cooled a bit even though the broader structure is still technically bullish.
Channel Breakdown
The ascending channel itself is doing most of the talking right now. As long as $SOL holds above the lower boundary, buyers still have the upper hand, and a bounce from here would put the $109.96 resistance back in play almost immediately.
Clearing that level with real volume behind it would flip the setup bullish and put $119.13 on the map, a zone that lines up neatly with where the chart's Wolfe Wave pattern is pointing too.
On the flip side, a rejection at these levels followed by a clean break of the channel's lower trendline would be a warning sign, opening the door toward the $94.46 support and, if that fails, down to $87.68.
Wolfe Wave Signal
The Wolfe Wave forming on the 4-hour timeframe adds another layer to this Solana price prediction.
These patterns typically resolve with a sharp move once the price breaks out of the converging structure, and in this case the target lines up closely with the $113 to $119 zone.
It is not a guarantee, but when a classic channel breakout and a Wolfe Wave target point toward the same neighborhood, traders tend to take notice.
Support and Resistance Levels
Level Type | Price |
Resistance 2 | $119.13 |
Resistance 1 | $109.96 |
Current Price | $101.46 |
Support 1 | $94.46 |
Support 2 | $87.68 |
Bull, Base, and Bear Case
Scenario | Level | Setup | Invalidation |
Bull | $109.96 to $119.13 | Break and hold above $109.96 with volume, targeting $119.13 in line with the Wolfe Wave projection. | Rejection at $109.96 and drop back inside the channel |
Base | $94.46 to $109.96 | Price continues ranging inside the ascending channel between support and resistance. | Break of either boundary with strong volume |
Bear | $87.68 to $94.46 | Break below the channel's lower trendline and $94.46 support, extending toward $87.68. | Reclaim of $94.46 and channel structure |
Expert Opinion
Market watchers following this Solana price prediction seem to agree on one thing: the fundamentals are quietly getting stronger even while the price consolidates.
Analysts point to growing institutional interest through products like the Bitwise Solana Staking ETF, plus traditional finance names like Schwab dipping their toes into SOL access, as signs that Solana is being treated less like a speculative meme play and more like core crypto infrastructure.
That said, most technical voices are cautious in the near term, noting that $SOL needs to clear $109.96 with conviction before anyone gets too excited about a run toward $119 and beyond.
Glossary
Ascending Channel: A chart pattern formed by two parallel upward-sloping trendlines, where price tends to bounce between the upper and lower boundaries.
Wolfe Wave: A five-wave price structure that often signals a strong directional move once price breaks out of its converging pattern.
RSI: Relative Strength Index, a momentum indicator measuring how fast and how much price has moved recently, typically read on a scale of 0 to 100.
Liquidation: The forced closing of a leveraged trading position when losses eat up a trader's margin, common in futures markets.
Support Level: A price zone where buying pressure has historically stepped in to slow or reverse a decline.
Resistance Level: A price zone where selling pressure has historically capped further gains.
Market Cap: The total value of all coins in circulation, found by multiplying price by circulating supply.
Methodology
This Solana price prediction is built using the 4-hour chart pattern, including the visible ascending channel, marked support and resistance levels, and RSI readings, combined with current exchange volume and liquidation data.
All price levels referenced are taken directly from the chart provided and are not extrapolated beyond what the pattern shows. Market sentiment context is drawn from recent public posts about Solana network activity and adoption news.
Disclaimer: This article is for informational purposes only and should not be treated as financial advice. Cryptocurrency markets are highly volatile, and prices can move sharply in either direction within short periods. Always do your own research and consult a qualified financial advisor before making any investment decisions.
Also read:
















