Pi Network Price Prediction: $PI Could Ignite a Fresh Bull Run


Pi Network started out as a mobile mining app built by a team of Stanford-linked developers back in 2019, letting people earn $PI just by tapping a button daily, and it eventually launched its own mainnet years later.
Today it's trading around $0.08882, up a little over 3% on the day, with a market cap near $982.693M that puts it around the 69th largest cryptocurrency.
This pi network price prediction hinges entirely on which side gives way first.
Live Market Data
Metric | Value |
Price | $0.08882 |
24h Change | +3.1% |
24h Range | $0.08613 - $0.09188 |
$982.693M | |
Fully Diluted Valuation | $1.512B |
24h Trading Volume | $6.923M |
Circulating Supply | 11.066B |
Total Supply | 17.024B |
Max Supply | 100B |
Source: $PI market cap data taken from Coingecko, data as of Aug 20, 2026. Figures may vary slightly across other tracking websites.
Social Sentiment of $PI
PayPal recently updated its official developer ecosystem to support Pi Network through its Pay with Crypto checkout program. 
Source: Data Taken From @BSCNews, X Account.
The revision, finalized on August 11, 2026, adds $PI to a whitelist of roughly 100 crypto assets eligible for use in transactions, which would let customers pay with PI at verified U.S. business merchants while PayPal converts the crypto to fiat in real time.
It's the kind of real-world utility news that can shift sentiment around a token even before it shows up directly in the price chart.
Key Takeaways
$PI is coiled at the apex of a symmetrical triangle on the daily chart, and which way it breaks will likely decide the next major move.
Current price sits at $0.08882, up 3.1% over the past 24 hours, inside a 24-hour range of $0.08613 to $0.09188.
A break above the triangle's upper boundary opens the path toward $0.10380, then $0.11847 and $0.12984.
A break below the lower boundary instead sends the price toward $0.08118, with a deeper floor at $0.07028.
PayPal recently added $PI to its Pay with Crypto whitelist, a real-world utility catalyst sitting alongside the technical setup.
Technical Analysis
Daily Chart Analysis for Pi Network Price Prediction
$PI has spent recent weeks compressing into a symmetrical triangle on the daily chart, with lower highs pressing down and higher lows pressing up until both lines meet near the apex, where price is sitting right now, based on TradingView data. 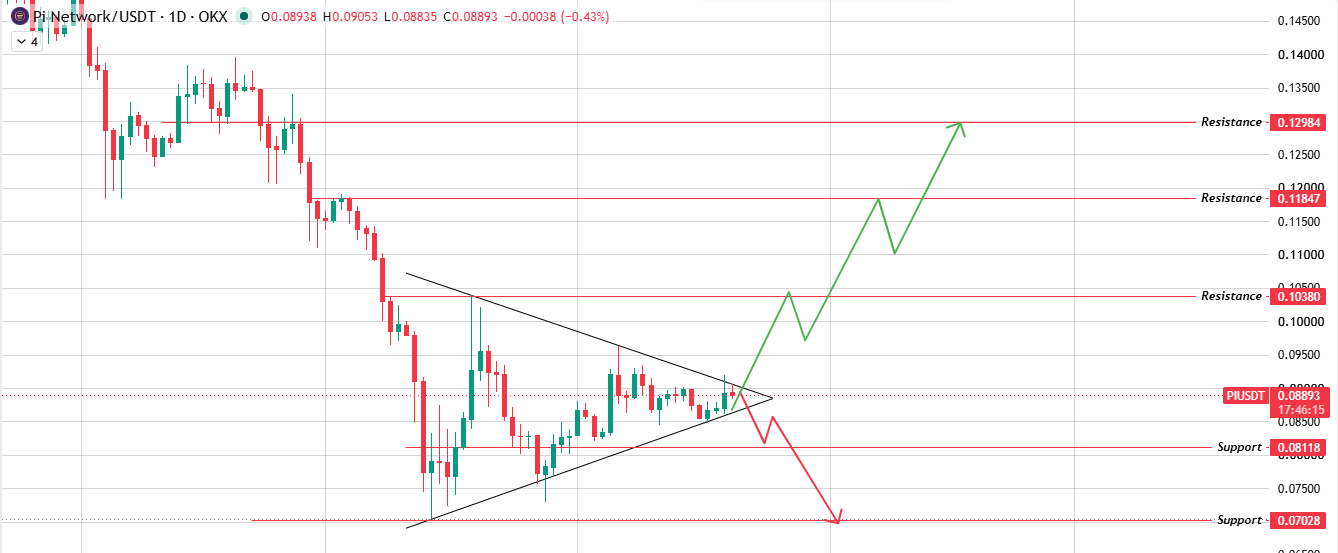
Source: Chart Taken From TradingView.
This is a classic decision-point pattern. If the price breaks above the upper falling boundary of the triangle, it opens room toward $0.10380 first, then $0.11847 and $0.12984 further out.
If it instead breaks below the lower rising boundary, price is likely headed toward $0.08118, with $0.07028 as the next floor if that level also gives way.
With the apex this tight, a decisive move in either direction could come quickly, making this pi network price prediction highly sensitive to the next few daily closes.
Support and Resistance Levels
Level Type | Price |
Resistance 3 | $0.12984 |
Resistance 2 | $0.11847 |
Resistance 1 | $0.10380 |
Immediate Price Reference | $0.08893 |
First Support | $0.08118 |
Structural Floor | $0.07028 |
These levels for this pi network price prediction are pulled directly off the daily chart, from the top resistance right down to the structural floor.
Bull, Base, and Bear Case
Scenario | Price level | Invalidation |
Bull | $0.10380 - $0.12984 | Fails to close above the triangle's upper boundary with volume |
Base | $0.08118 - $0.10380 | Price keeps compressing inside the triangle without a decisive break. |
Bear | $0.07028 or lower | The lower boundary of the triangle gives way, and support at $0.08118 fails. |
These three scenarios anchor this pi network price prediction, weighted by which side of the triangle breaks first.
Glossary
Symmetrical Triangle: A chart pattern formed by a series of lower highs and higher lows converging toward a single point, typically signaling an impending breakout in either direction.
Breakout: A price move above (or below) a defined chart boundary, often signaling a potential trend shift.
Apex: The point where a triangle pattern's two converging trendlines meet, often marking where a breakout becomes imminent.
Resistance: A price level where selling pressure has historically been strong enough to stop further upward movement.
Support: A price level where buying pressure has historically been strong enough to halt further downward movement.
Market Cap: The total value of all circulating coins, calculated as price multiplied by circulating supply.
Circulating Supply: The number of coins currently available and trading in the market, as opposed to the total or max supply.
Methodology
All price levels and the triangle structure referenced in this PI network price prediction are derived directly from the 1D PI/USDT chart on TradingView, cross-checked against live market data at the time of writing. No price levels are extrapolated beyond what the chart structure supports.
Disclaimer: This article is for informational purposes only and does not constitute financial, investment, or trading advice. Cryptocurrency markets are highly volatile, and prices can change. rapidly. Always conduct your own research and consult a licensed financial advisor before making investment decisions.







.webp)








