Pi Network Price Prediction: RoboPay Could Send $PI Skyrocketing


Pi Network started as a mobile mining project that let users earn $PI coins from their phones before its mainnet and exchange listings arrived.
$PI now trades around $0.08922, holding inside a tight range after a sharp pullback from recent highs.
This Pi Network price prediction looks at where price could head next based on the current chart setup.
Live Market Data
Here's the live snapshot behind this $PI network price prediction.
| Metric | Value |
| Price | $0.08922 |
| 24h Change | +2.3% |
| 24h Range | $0.08709 – $0.09194 |
| $989.751M | |
| Fully Diluted Valuation | $1.523B |
| 24h Volume | $7.781M |
| Circulating Supply | 11.092B |
| Total Supply | 17.064B |
| Max Supply | 100B |
Source: $PI market cap data taken from Coingecko, data as of Aug 24, 2026. Figures may vary slightly across other tracking websites.
Pi Network New Analysis
Pi Network has joined RoboPay as a payment partner, letting $PI holders pay for real-world robot services on a network run by the Fabric Foundation. 
Source: $PI Network Data Taken From @BenX_HQ , X Account.
The reaction has been mixed, with some pointing out that $PI being accepted inside other platforms' payment systems could matter more long-term than another app built solely within Pi's own ecosystem.
Key Takeaways
-
This pi network price prediction shows $PI trading near $0.08922, up 2.3% in the last 24 hours.
-
Price is inside a descending channel on the hourly chart after a sharp red candle wiped out buyer liquidity.
-
A breakout above the channel with volume could send $PI toward $0.09652, then $0.10196 and $0.11087.
-
Rejection from resistance could push the price back to $0.08606, with $0.08303 as the next support.
-
Pi Network just joined RoboPay as a payment partner, letting $PI holders pay for real-world robot services.
Technical Analysis Pi Network
Sharp Pullback and Liquidity Wipe
On the hourly chart , Pi Network ran up strongly before a large red candle wiped out a big chunk of buyer positions in one move.
This kind of candle usually clears out over-leveraged longs and resets the market before the next real move, and it sets the stage for the current channel structure in this Pi network price prediction.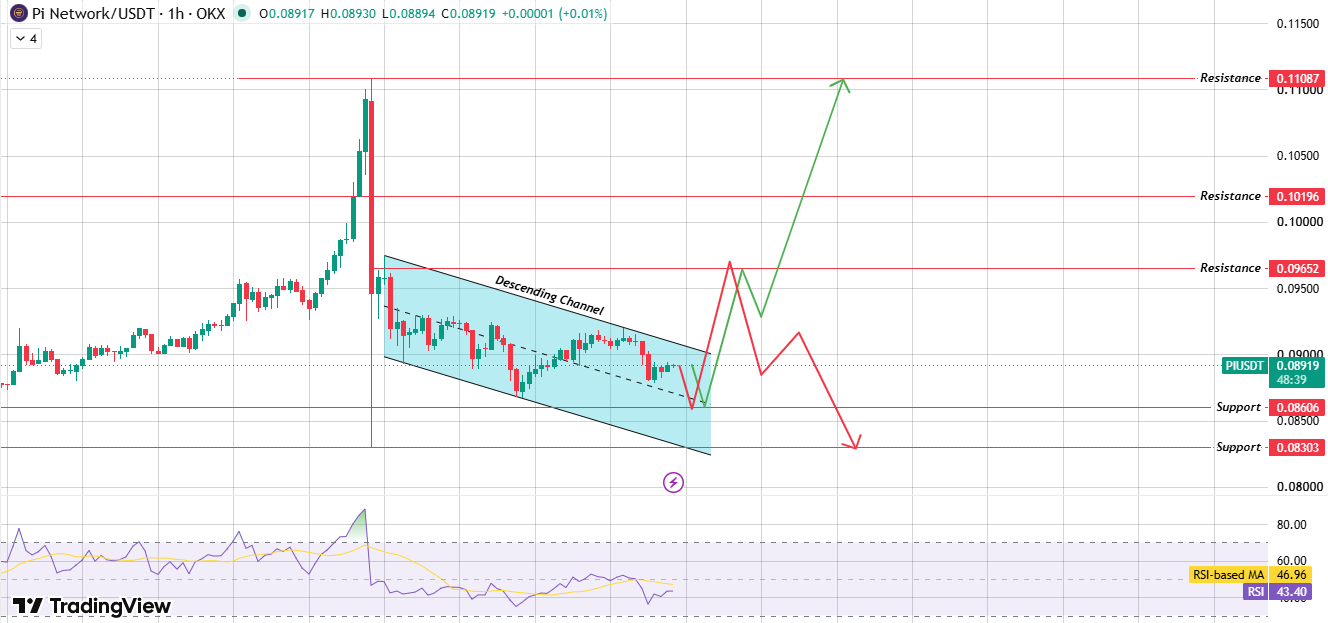
Source: Chart Taken From TradingView.
Descending Channel Structure
After that pullback, $PI has been trading inside a descending channel, making lower highs and lower lows in an orderly range.
Breakout or Breakdown Setup
If the price bounces from support and breaks the channel's upper boundary with strong volume, it opens the path toward $0.09652 and beyond.
If instead $PI can't sustain that bounce and gets rejected at resistance, price is likely to roll over toward $0.08303, keeping the channel's downward structure intact.
Hourly Support and Resistance Levels
| Level Type | Price |
| R3 | $0.11087 |
| R2 | $0.10196 |
| R1 | $0.09652 |
| S1 | $0.08606 |
| S2 | $0.08303 |
Bull, Base, Bear Case
This pi network price prediction breaks the setup into three scenarios.
| Setup | Trigger | Level |
| Bull | Bounce from support, breaks the channel's upper boundary with volume | $0.09652, then $0.10196 and $0.11087 |
| Base | Price stays inside the descending channel. | Range-bound chop between support and resistance |
| Bear | Rejection from resistance, channel support fails | $0.08606, then $0.08303 |
Expert Opinion
As per Coingabbar Market Analysts watching, $PI notes that sharp liquidation candles followed by orderly consolidation often mark a healthy reset rather than a trend reversal.
The RoboPay partnership adds a real-world utility angle that could support sentiment beyond pure speculation.
Still, most technical voices caution that a $PI network price prediction should stay chart driven, since a failed bounce inside a descending channel usually leads to continuation lower.
Watching how $PI reacts at the channel's upper boundary is the key thing to track next.
Glossary
Descending Channel: A chart pattern formed by two parallel downward-sloping lines that contain price action during a downtrend.
Liquidity Wipe: A sharp price move that forces out a large number of leveraged trading positions at once.
Resistance: A price level where selling pressure has historically been strong enough to stop an uptrend.
Support: A price level where buying pressure has historically been strong enough to stop a downtrend.
RSI: Relative Strength Index, a momentum indicator used to gauge whether an asset is overbought or oversold.
Methodology
This Pi network price prediction is based on hourly timeframe chart analysis, current market data, and Market Pulse context at the time of writing. Levels are drawn directly from chart structure and are not extrapolated beyond visible price action.
Disclaimer: This article is for informational purposes only and does not constitute financial advice. Cryptocurrency markets, including $PI Network, are highly volatile and carry significant risk of loss. Always do your own research and consult a qualified financial advisor before making any investment decisions.
Also read:












.webp)




