Cash Cat Price Prediction: Can CASHCAT Sustain Its 150% Rally?


CASHCAT has had a wild week, and right now it's parked at a level that decides everything else.
Hold this floor and there's genuine room to climb back toward its recent highs. Lose it, though, and the coin probably dips to fill a gap it left behind during that explosive move up before sorting out where it actually wants to go.
What matters here isn't the hype cycle around it. This cash cat price prediction sticks strictly to what the charts show.
Live Market Data
$CASHCAT is currently trading at $0.1122, and up today 27.6% over the past 24 hours after ranging between $0.08643 and $0.1302 in that window. 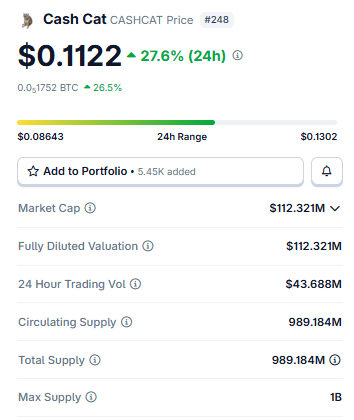
Source: Market Cap Data Taken From Coingecko, data as of Aug 06, 2026. Figures may vary slightly across other tracking websites.
Market cap comes in at $112.321M, essentially the same as fully diluted valuation since circulating supply (989.184M) is almost identical to total supply.
Trading volume over 24 hours reached $43.688M, and the token's max supply caps out at 1B CASHCAT.
Liquidation Heatmap
The liquidation heatmap here tells a striking story. Just $116.10 got liquidated in the past hour, all of it shorts. Four hours brought $26.98K, again mostly shorts at $23.26K. 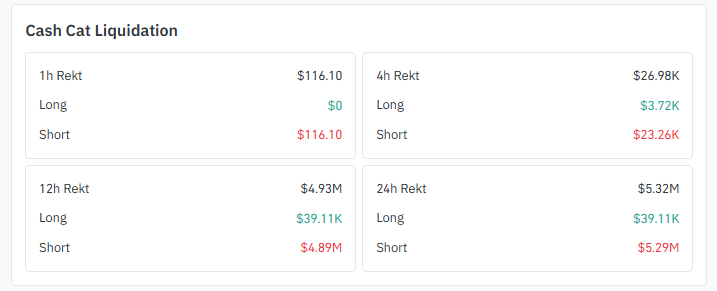
Source: Liquidation Data Taken From Coinglass.
Then the bigger numbers show up: $4.93M over 12 hours, $5.32M over 24, with shorts eating nearly all of it at $4.89M and $5.29M respectively. Longs barely registered, $39.11K across both windows.
Short sellers betting against this rally have been getting squeezed hard.
That kind of imbalance often adds fuel to the upside too, since forced short covering means more buying pressure whether traders want it or not.
Exchange Volume
Exchange volume for $CASHCAT futures is concentrated almost entirely on two platforms. 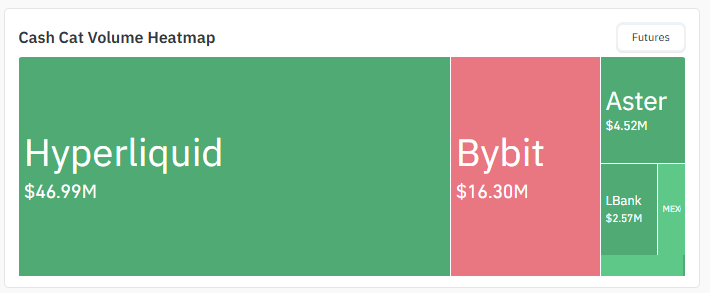
Source: Volume Heatmap Data Taken From Coinglass.
Hyperliquid leads by a wide margin at $46.99M, Bybit trails at $16.30M. Aster and LBank add smaller amounts, $4.52M and $2.57M.
This lean toward newer, less traditional venues reflects exactly what CASHCAT is right now: a fresh, still-thin market compared to established large-cap tokens.
Social Sentiment
So what's actually behind this move? This cash cat price prediction can't ignore the bigger story. 
Source: Data Taken From @BSCNews, X Account.
Uniswap's new Pools token launchpad went live on Robinhood Chain, letting users launch, discover, and trade tokens with permanently locked liquidity, and CASHCAT jumped roughly 33% on that news alone.
It's part of a broader memecoin boom on the chain that's also lifted tokens like Pipedog and Tendies.
Whether this momentum sticks probably comes down to how much attention Robinhood Chain keeps getting, more than anything specific to CASHCAT itself.
Key Takeaways
-
$0.1122 and up 27.6% today; that's CASHCAT right now, riding a roughly 150% weekly gain tied to Robinhood Chain memecoin hype
-
Hold $0.1016, and this cash cat price prediction points toward $0.1563, maybe $0.1899 if volume keeps building behind it
-
Short sellers just took a beating; $5.29M liquidated over 24 hours against barely $39K on the long side
-
Support fails, and the price probably drops to fill an open fair value gap near $0.0786 before it figures out what's next
-
Worth remembering: this is a young, thinly traded microcap, and swings here move faster and sharper than on established tokens
Technical Analysis
1-Hour Chart Analysis of $CASHCAT
Look at the 1H chart, and CASHCAT is riding a rising trendline that's held the bounce so far. 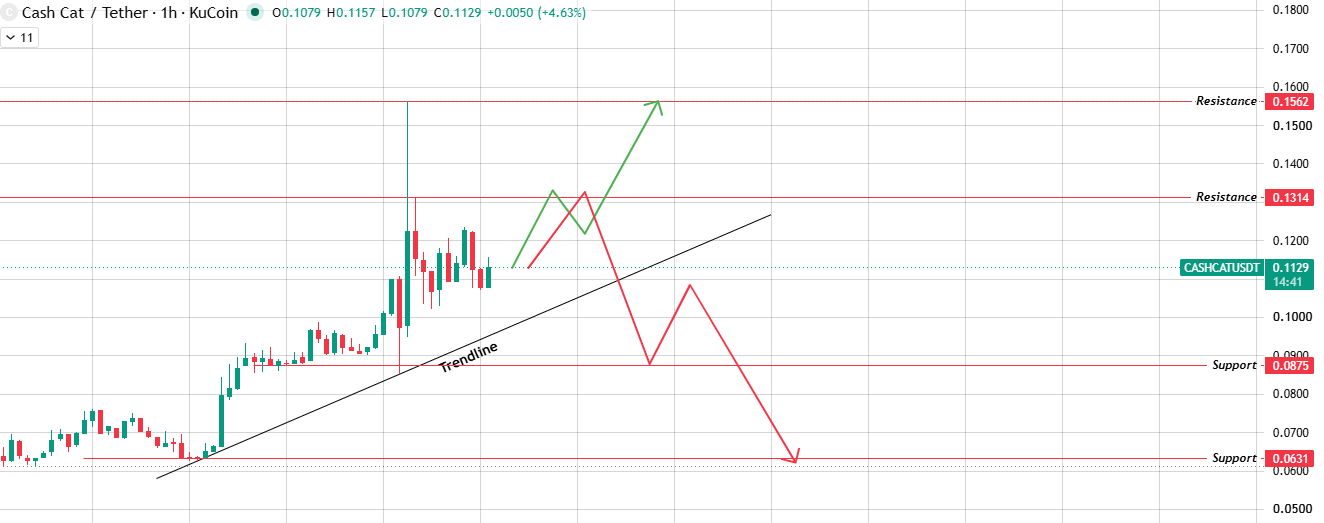
Source: Chart Taken From TradingView.
Keep it and continue upside targets of $0.1314 first, then $0.1562.
Break it instead, and the price likely slides to $0.0875, with $0.0631 waiting underneath if selling picks up.
Daily Chart Analysis of $CASHCAT:
The real story, though, is on the 1D chart. CASHCAT is testing support right at $0.1016 after its sharp weekly rally.
Volume confirming buyers are defending that level opens the door toward $0.1563, then $0.1899. 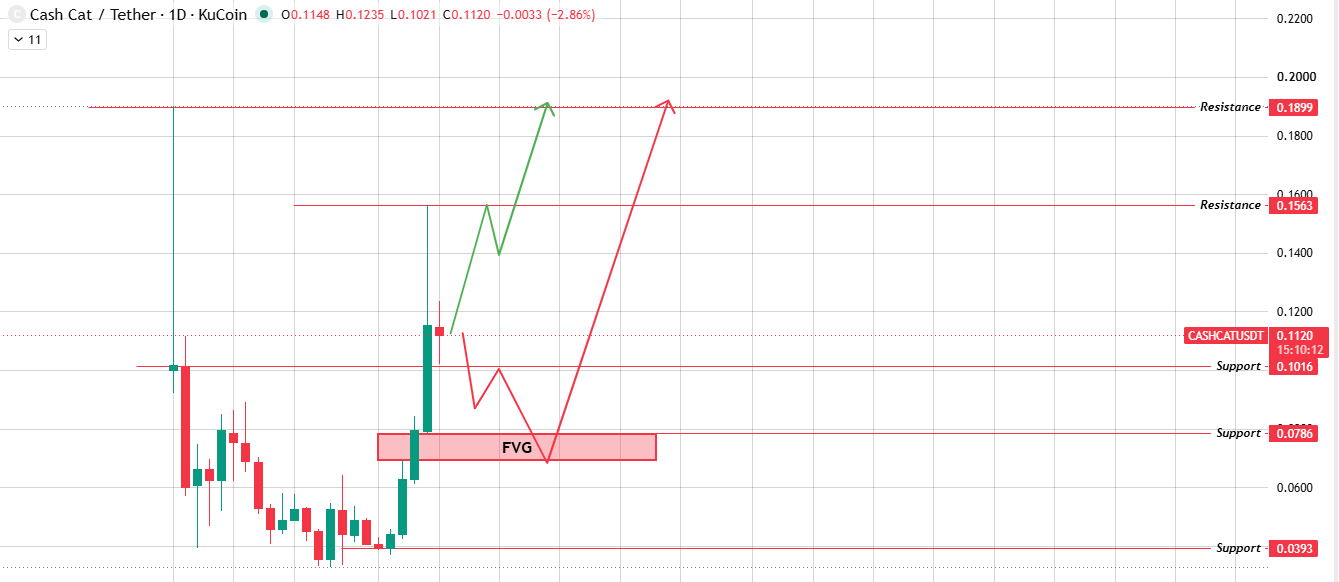
Source: Chart Taken From TradingView.
Push above $0.1899 on strong volume, and the $0.20 round number comes within reach, though that sits just past the chart's current resistance zone.
Fail to hold support, on the other hand, and price is likely to drop and fill a fair value gap, an imbalance zone left behind during the fast move up, sitting somewhere between $0.0786 and roughly $0.10.
Once that gap fills, what happens next is genuinely open.
Price could bounce back up just as easily as it could keep sliding, with $0.0393 marking the next major support if the decline runs that far.
Bull, Base, and Bear Cases
Invalidation: the bull case fails if CASHCAT loses $0.1016 without a bounce, opening the door to the bear scenario instead. The bear case is invalidated if buyers step in hard at the $0.0786 fair value gap and reject it quickly rather than grinding through it.
Risks
Given the coin's age and size, this cash cat price prediction comes with real caveats attached.
CASHCAT is a newly launched microcap with limited trading history, and that alone means price swings here run considerably sharper than on established tokens.
The heavy short liquidation activity is bullish short-term, sure, but it also points to a market that's still finding its footing, one that could reverse quickly if buying interest fades.
And thin liquidity on smaller exchanges adds real slippage risk for anyone trading in size.
Glossary
Fair Value Gap (FVG): A spot on the chart where a fast move skipped over a price range without much actual trading happening, leaving an imbalance that price often comes back to fill later.
Support Zone: An area where buyers have shown up before, acting like a floor whenever the price drops back toward it.
Liquidation Heatmap: A breakdown showing where leveraged positions got forcibly closed and how much was wiped out in the process.
Exchange Volume: How much actual trading a token sees across exchanges, often used to check whether a price move has real backing behind it.
Price Target: Wherever a chart pattern or trend suggests price could realistically head if the setup plays out as expected.
Disclaimer: This article is for informational purposes only and does not constitute financial advice. Cryptocurrency markets are highly volatile, and newly launched, low-market-cap tokens like CASHCAT carry substantially higher risk than established assets. All price levels referenced are derived directly from TradingView chart data, and liquidation figures come from Coinglass. Always conduct independent research before making investment decisions.


















