Sonic Price Prediction September 2026: Bulls Eye $0.15


Sonic, the high-speed EVM chain formerly known as Fantom, has been trading heavily this year as the broader altcoin market chops through a rough stretch, and $S remains an actively watched name among traders tracking new-generation Layer 1 tokens.
$S currently trades at $0.03135, up 11.6% on the day, with a market cap of $121.86M.
This sonic price prediction September 2026 update looks at where the coin could head next as it tests support inside a multi-month descending channel.
Price Today: Live Data and 24-Hour Change
Metric | Value |
Price | $0.03135 |
24H Change | +11.6% |
24H Range | $0.0275 - $0.03342 |
Market Cap | $121.86M |
Fully Diluted Valuation | $121.86M |
24H Trading Volume | $41.403M |
Circulating Supply | 3.885B S |
Total Supply | 3.885B S |
Max Supply | Infinite |
Source: Market data as referenced from Coingecko live exchange, as of Aug 27, 2026. Figures may vary slightly across other tracking platforms.
Key Takeaways
$S trades at $0.03135, up 11.6% on the day, after the current weekly candle bounced sharply off the lower boundary of its descending channel.
The weekly chart shows S still trading inside that descending channel, with price now testing support at the channel floor near $0.02716.
A volume-backed break above the upper boundary of the channel could send S climbing toward $0.06594, then $0.09180, and eventually $0.15416.
A rejection from the upper boundary of the channel would likely send the price back down toward the lower support levels, keeping the broader downtrend intact.
Large liquidity pools sit stacked above the current price, meaning a confirmed breakout could accelerate quickly once that liquidity gets tapped.
Weekly Chart Analysis
$S has been trading inside a descending channel on the weekly chart for months, with price grinding lower in a series of compressed candles as the broader downtrend stayed in control.
The current weekly candle is testing support at the floor of that channel, near $0.02716, after bouncing sharply off the recent low.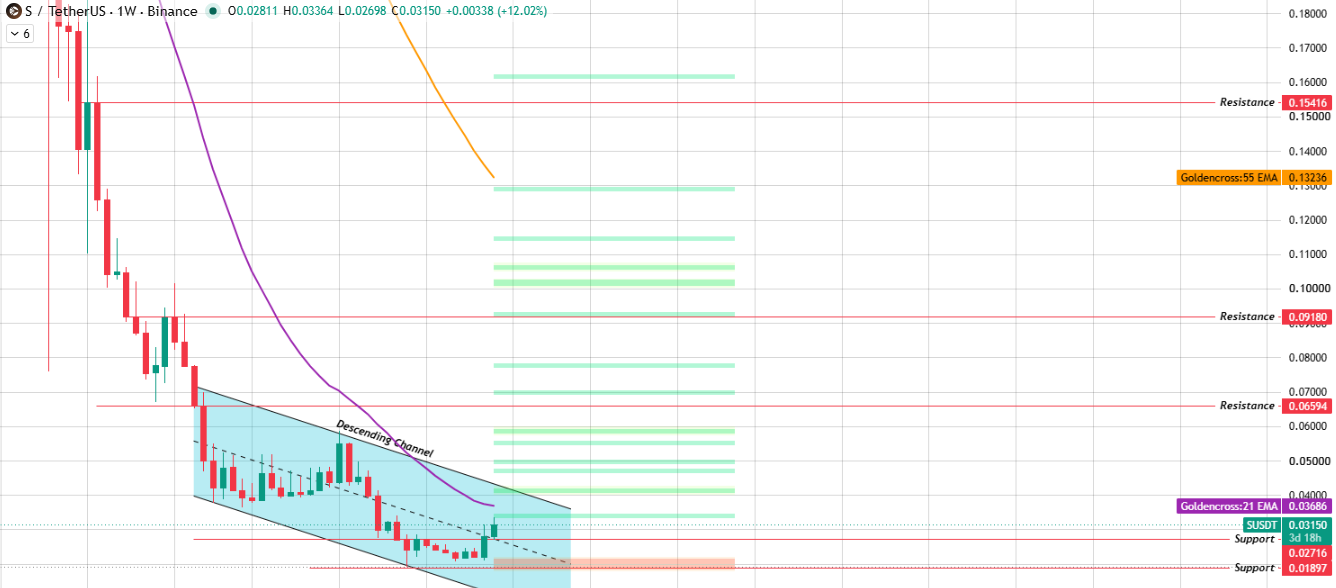
Source: Weekly Chart Taken From TradingView.
The setup here plays out in two possible ways from current levels.
If fresh volume comes in and the price manages to break above the upper boundary of the channel, S could move quickly toward $0.06594, then $0.09180, and eventually $0.15416.
Since a large stack of liquidity sits waiting above those levels for this sonic price prediction September 2026 outlook.
If instead the price gets rejected at the upper boundary of the channel, sellers likely regain control, and $S risks sliding back toward the $0.02716 and $0.01897 support zone.
EMA Levels (Weekly)
EMA | Price |
55 EMA | $0.13236 |
21 EMA | $0.03686 |
Technical Analysis: Key Support and Resistance
Level Type | Price |
Resistance 3 | $0.15416 |
Resistance 2 | $0.09180 |
Resistance 1 | $0.06594 |
Support 1 | $0.02716 |
Support 2 | $0.01897 |
Sonic Price Prediction September 2026: Bull, Base, and Bear Case
Scenario | Level | Setup | Invalidation |
Bull | $0.06594 - $0.15416 | S holds the channel support, breaks the upper boundary of the descending channel with volume, and taps into the large liquidity pockets stacked above, pushing toward $0.09180 and $0.15416. | Weekly close back below the $0.02716 support zone. |
Base | $0.02716 - $0.06594 | S bounces off support but can't clear the upper channel boundary with conviction, chopping inside the descending channel while volume stays muted. | Extended range-bound trade without a confirmed break of either boundary. |
Bear | $0.01897 - $0.02716 | The channel support fails, or the price gets rejected at the upper boundary, and sellers push S down toward the $0.01897 support level. | Reclaim and hold above the channel support zone. |
On-Chain and Fundamental Drivers (S)
Sonic's market cap of $121.86M is identical to its fully diluted valuation, since the entire 3.885B token supply is already circulating with no further unlocks left to dilute holders.
That fully circulating supply removes one common overhang that weighs on many newer Layer 1 tokens, leaving price action largely driven by network adoption and broader market sentiment.
Daily trading volume of $41.403M against a $121.86M market cap points to solid liquidity relative to the token's size, especially during a session with an 11.6% daily move.
September Catalysts That Could Move the Price
Network activity and developer migration onto the Sonic chain remain the biggest fundamental driver for $S, since adoption metrics tend to move price faster than headlines for infrastructure tokens like this.
Broader altcoin sentiment and risk appetite will help decide whether $S can sustain a break out of its long-running descending channel.
Bitcoin's price direction continues to set the outer boundary for how much room smaller Layer 1 tokens like S have to recover.
What Analysts Are Forecasting
Price target estimates for this sonic price prediction September 2026 vary across trackers, with no strong consensus on a single September number given how compressed this channel has become.
The more reliable approach is to treat the technical levels above as the actual forecast, with the channel support and upper boundary deciding the near-term path.
Risks That Could Invalidate This Forecast
This entire technical picture rests on how S behaves around the current support test at the floor of the descending channel.
A breakdown through that support without a volume-backed bounce would open the path toward the $0.01897 level.
Beyond the chart, any broad risk-off move across crypto markets or a slowdown in network activity could keep S trapped inside this channel well past September.
How to Buy and Store It Safely
Stick to a major exchange with real order book depth for a token this volatile, since an 11.6% daily move like this can chew through thin liquidity fast.
Keeping a small trading amount on an exchange is fine, but for anything held longer term, move it off to a hardware wallet or a wallet you control the keys to.
Given how compressed this channel has become, position sizing matters more here than with larger, less volatile assets.
Disclaimer: This article is for informational purposes only and does not constitute financial advice. Cryptocurrency markets are highly volatile, and prices can move sharply in either direction without warning. Always do independent research and consult a licensed financial advisor before making investment decisions.

















