Shiba Inu Price Prediction: $SHIB Flashes a Powerful Bullish Signal


Our Shiba Inu price prediction for the near term hinges on whether the price can hold above its recent breakout zone.
If buyers defend this area, $SHIB could climb toward the next resistance band.
If sellers push the price back down, a drop toward lower support levels becomes likely before any fresh recovery attempt.
Live $SHIB Price Data
Shiba Inu is currently priced around $0.00000485, slipping 0.4% over the past 24 hours after an early spike on July 25 and 26 pushed the price sharply higher before cooling off. 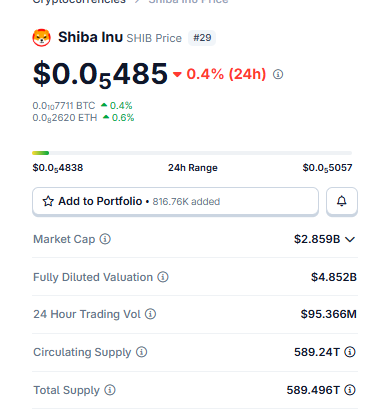
Source: $SHIB Market Cap Data Taken From Coingecko, data as of Aug 03, 2026. Figures may vary slightly across other tracking websites.
The token carries a market cap of $2.859B against a fully diluted valuation of $4.852B, with circulating supply at 589.24T out of a 589.496T total supply, leaving a relatively small gap between circulating and total tokens compared to most meme coins.
24-hour trading volume stands at $95.366M, showing the meme coin is still pulling decent liquidity despite the pullback, and this volume will be the deciding factor in whether the current trendline retest turns into a genuine breakout or fades back into the prior range.
Exchange Volume and Liquidation Snapshot
Spot volume is led by Upbit at $6.04M and Binance at $4.76M, followed by OKX at $2.22M, Bybit at $2.18M, and Gate at $1.53M. 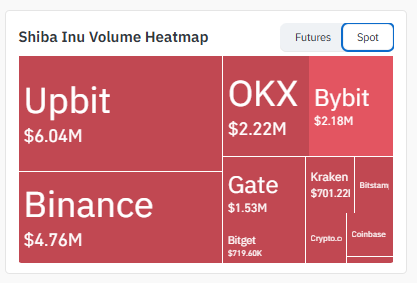
Source: Volume Data Taken From Coinglass on 03.08.2026
Showing liquidity is fairly spread across major venues rather than concentrated on one exchange.
This kind of distribution generally makes sharp, single-exchange-driven wicks less likely.
On the derivatives side, 24-hour liquidations total $176.06K, split between $136.43K in long positions and $39.63K in shorts, suggesting leveraged buyers have taken the bigger hit during this pullback. 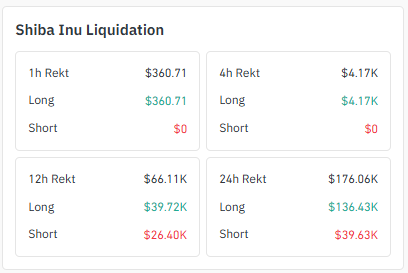
Source: Liquidation Data Taken From Coinglass on 03.08.2026
The shorter 4-hour and 1-hour windows show liquidations concentrated almost entirely on longs, hinting that late buyers chasing the recent spike got caught out first as price cooled into consolidation.
Shiba Inu News Today
A separate report this week highlighted a sharp jump in SHIB's burn rate, with the pace of token destruction climbing over 400% and more than 124 million SHIB removed from circulation in a single 24-hour window.
Source: Data Taken From @Utoday_en, X Account.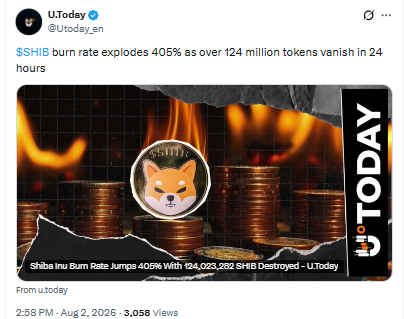
A burn spike of this size is often read as a bullish signal by holders, since it trims supply even as total supply remains massive at 589.496T.
Analysts note that burn rate surges tend to matter more when paired with rising volume and price strength, which ties back to whether the current trendline retest holds.
Key Takeaways
SHIB trades near $0.00000485, down 0.4% in 24 hours, after retesting a falling trendline breakout on the 4H chart.
A confirmed breakout could push the price toward the $0.00000540 and $0.00000584 resistance zones.
A failed retest may drag SHIB back to the $0.00000458 support and, in a deeper flush, toward the order block near $0.00000411.
The daily chart shows the same falling trendline structure, with $0.00000587 and $0.00000670 as the next resistance targets if bulls take control.
24-hour liquidations sit at $176.06K, with longs bearing the bulk of the pain at $136.43K.
4H Chart Technical Analysis
On the 4H chart, $SHIB spent weeks building a demand zone between $0.00000411 and $0.00000458, an order block that fueled a sharp rally once volume picked up.
Price then cooled into a tight consolidation box between roughly $0.00000458 and $0.00000486, and it has just pushed through the falling trendline that capped that entire move. 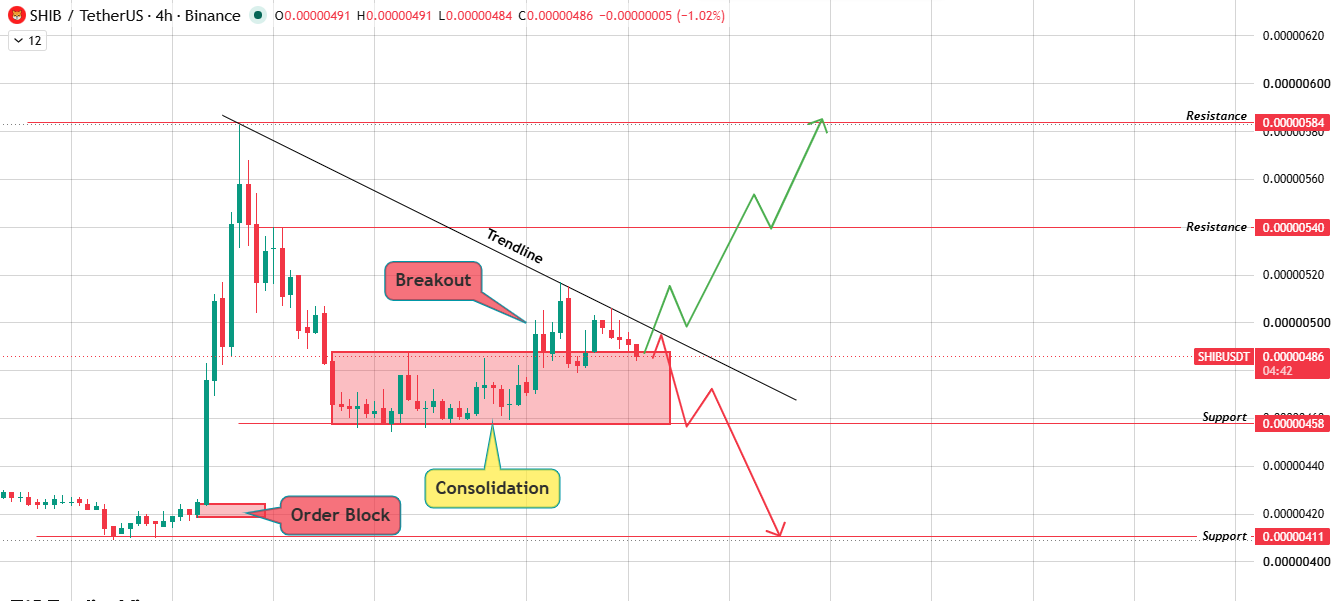
Source: Chart Taken From TradingView.
This shiba inu price prediction treats the current candle as a trendline retest rather than a confirmed breakout.
If buying volume holds this retest and breaks the trendline, price has room to climb toward $0.00000540 and then $0.00000584.
If the retest fails and the consolidation support gives way, $SHIB risks sliding back to $0.00000458 and potentially down to the $0.00000411 demand zone, where a bounce would be the first sign buyers are stepping back in.
Daily Chart Technical Analysis
The daily timeframe carries the same falling trendline that has capped $SHIB since its recent local top. 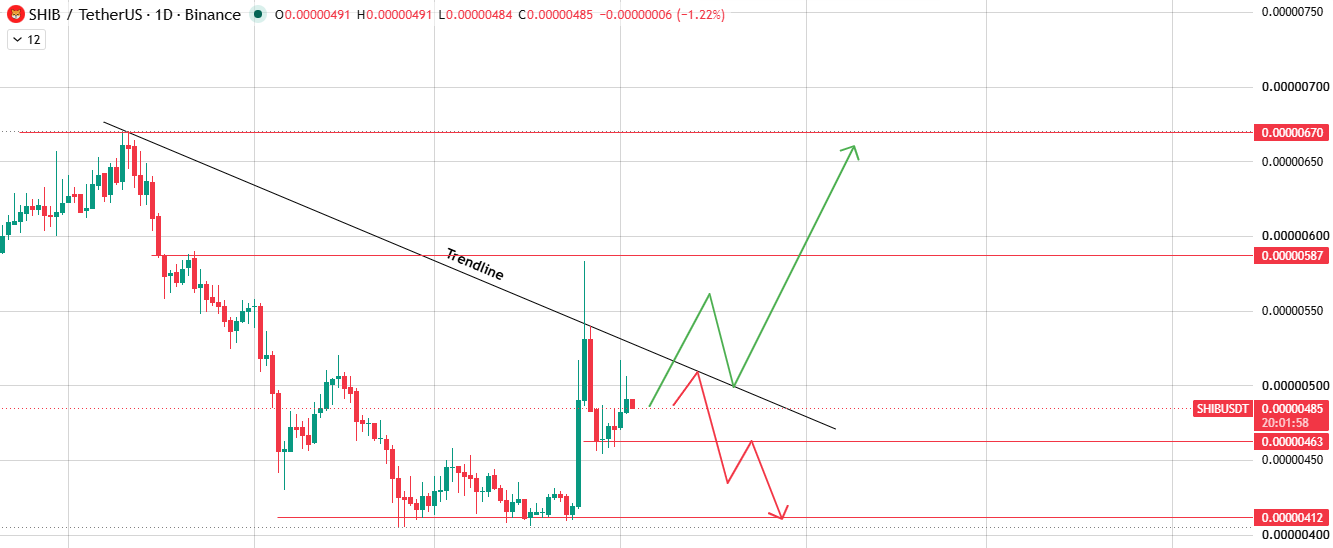
Source: Chart Taken From TradingView.
A volume-backed breakout of the trendline would open the path toward $0.00000587, with $0.00000670 as the next major resistance if momentum extends further.
If this breakout fails and the price takes rejection from the trendline, the daily chart points to $0.00000463 as the first support, followed by $0.00000412 as a deeper downside target.
This structure keeps the daily Shiba Inu price prediction tied closely to how price behaves around the trendline over the coming sessions.
Bull vs Bear Scenarios
In the bullish case, a clean volume-backed break and retest hold above the trendline sends SHIB toward $0.00000540 on the 4H chart, extending to $0.00000587 and $0.00000670 on higher timeframes.
In the bearish case, the retest fails, consolidation support at $0.00000458 breaks, and price drifts toward $0.00000411 to $0.00000412, where the prior order block sits as the next demand area.
This balanced framework keeps both outcomes on the table until the candle closes, not intraday wicks, confirming which side takes control.
Methodology: This forecast is based on technical analysis of TradingView 4H and daily charts, current market data, exchange volume distribution, and liquidation data. It does not constitute financial advice.
Glossary
Order Block: A price zone where large buying or selling previously occurred, often acting as future support or resistance.
Trendline: A line connecting price highs or lows used to identify the direction and boundaries of a trend.
Consolidation: A period where price trades within a tight range before a breakout or breakdown.
Liquidation: The forced closure of a leveraged position when losses exceed available margin.
Resistance Level: A price zone where selling pressure has historically stalled or reversed an uptrend.
Disclaimer: This content is for informational purposes only and should not be treated as financial advice. Cryptocurrency markets, including meme coins like Shiba Inu, are highly volatile and carry significant risk of loss. Always do your own research and consult a licensed financial advisor before making investment decisions.


















