Shiba Inu Price Prediction: $SHIB Biggest Breakout of 2026 Is Loading


Coiled and waiting. That's the best way to describe $SHIB right now. This shiba inu price prediction comes down to a tight squeeze in price on the shorter time frame, layered on top of a bigger upward push that's already underway on the bigger picture chart.
Worth remembering too, $SHIB is still sitting close to 94% below its all-time high from back in October 2021, so any current move plays out against a coin that's been rebuilding from deep lows for years.
Live Market Data
$SHIB is currently trading around $0.00000492, down 1.5% on the day.
Market cap sits near $2.9 billion, with a fully diluted valuation of $4.922 billion given the massive circulating supply. 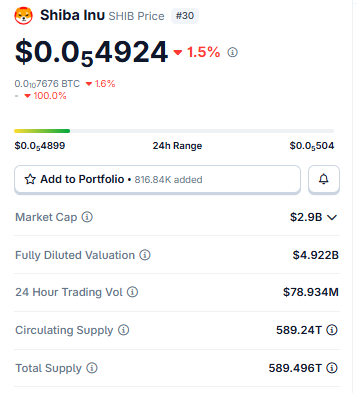
Source: $SHIB Market Cap Data Taken From Coingecko, data as of Aug 05, 2026. Figures may vary slightly across other tracking websites.
24-hour trading volume comes in at $78.93 million. Circulating supply: 589.24 trillion tokens.
Exchange Volume Data of $SHIB
Exchange volume for $SHIB is notably thin right now, and that's worth flagging upfront.
Bybit leads with $3.64 million over 24 hours, OKX follows at $2.42 million, and Gate adds another $1.94 million.
Coinbase, Kraken, and Bitstamp trail well behind, each under $600K.
Source: Volume Heatmap Data Taken From Coinglass.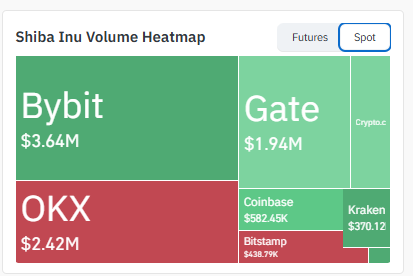
Thin volume like this means moves can happen fast in either direction, sometimes without much warning.
Liquidation Data of $SHIB
The liquidation heatmap leans one way here too. Over 24 hours, $53.47K got liquidated total, and longs made up $37.27K of that against just $16.20K in shorts.
Zooming into the 1-hour window, it's even more lopsided; every dollar liquidated came from long positions, with nothing on the short side.
Source: Liquidation Data Taken From Coinglass.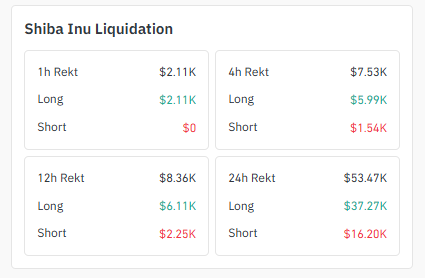
Overall totals are small compared to bigger caps, but the skew toward longs suggests buyers have been a touch too eager on recent bounces.
Social Sentiment of Shiba Inu Coin:
A widely followed crypto research account recently pointed out that SHIB's headline market cap can be misleading on its own.
Despite sitting among the larger tokens by that measure, the account noted SHIB remains roughly 94.2% off its peak price, a gap reached back in October 2021. 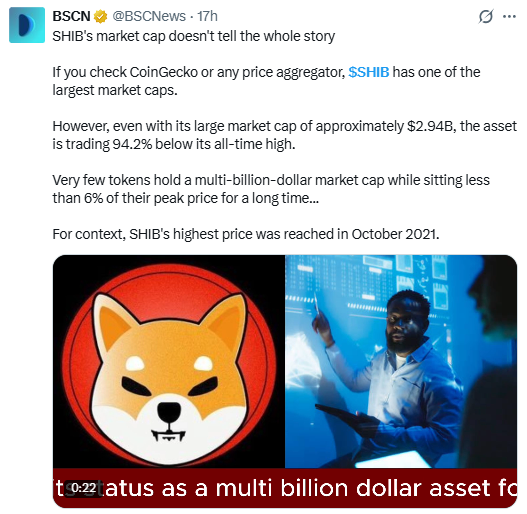
Source: Data taken from @BSCNews, X Account.
The point being made: A multi-billion-dollar market cap doesn't always mean a token is anywhere close to healthy price levels, especially for one with a supply as large as SHIB's.
It's a useful reminder for anyone reading this shiba inu price prediction purely through a market-cap lens instead of price action.
Key Takeaways
-
SHIB trades near $0.00000492, right at the apex of a tightening symmetrical triangle on the hourly chart.
-
The daily chart shows price breaking above a long-standing trendline out of a demand zone, a structure that often precedes bigger moves.
-
Clear the triangle's upper boundary, and $0.00000520 comes into play, with $0.00000536 as the stretch target.
-
Lose the lower boundary instead, and $0.00000482 is first up, then $0.00000469.
-
The daily structure points further out toward $0.00000596 and eventually $0.00000725, assuming the breakout holds.
Hourly Chart: Symmetrical Triangle
Zooming on the 1H chart , SHIB has squeezed itself into a symmetrical triangle, with the price parked right near the apex. 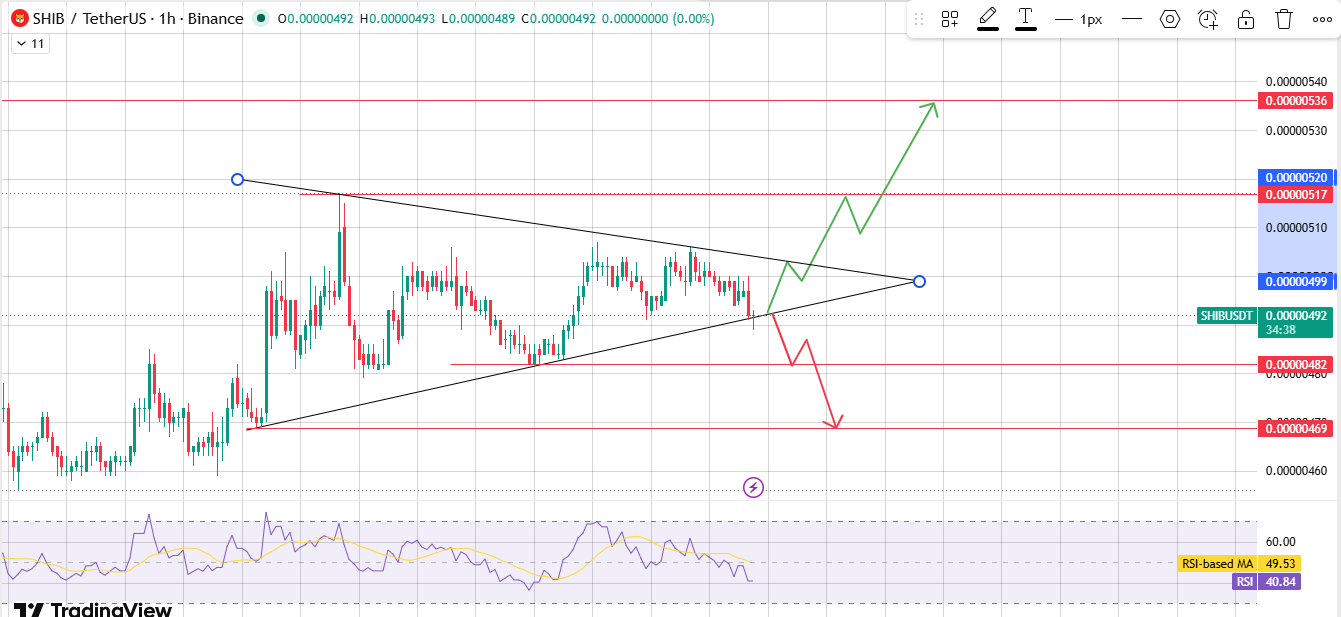
Source: Chart Taken From TradingView.
Break the upper boundary, and $0.00000520 is the near-term target, with a bullish breakout stretching toward $0.00000536 if volume follows through.
Break the lower boundary instead, and a bearish breakdown points first to $0.00000482, then $0.00000469 if sellers keep pushing.
RSI on this timeframe sits near the midpoint, so momentum hasn't picked a side just yet either.
Daily Chart: Trendline Breakout?
Something shifted on the 1D chart. Price spent months grinding along a demand zone, then broke above a descending trendline that had capped it for weeks.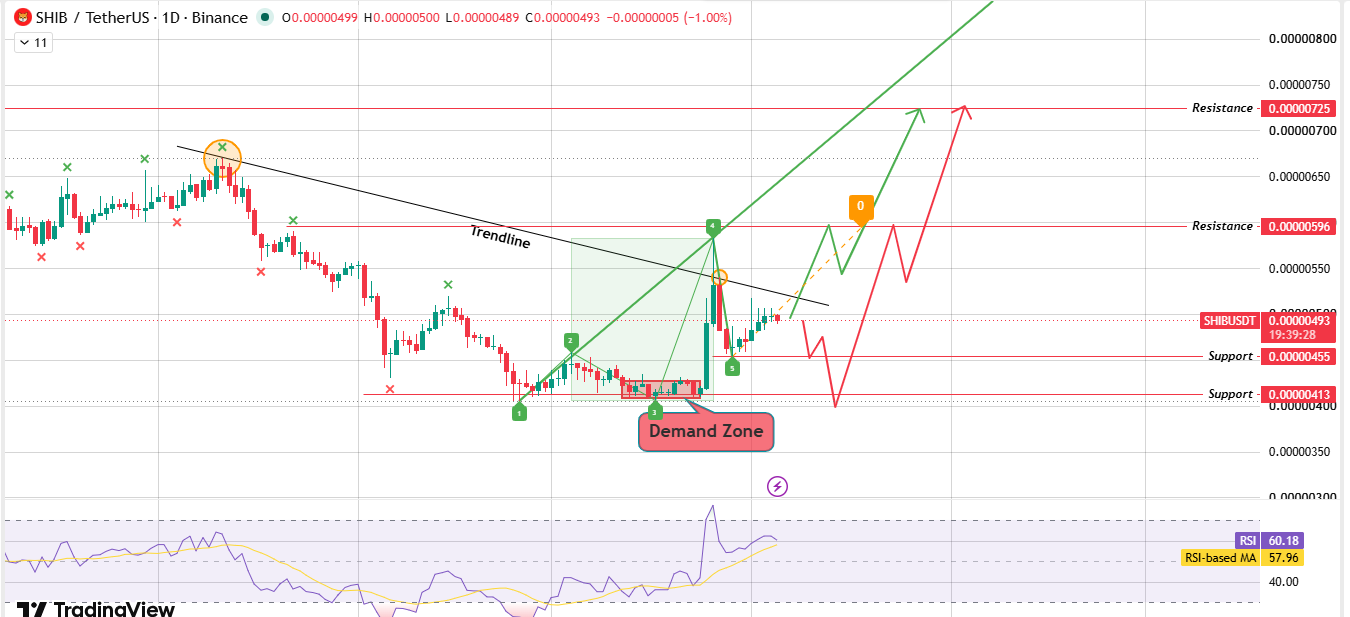
Source: Chart Taken From TradingView.
That breakout puts a bullish path on the table. If momentum carries through, $0.00000596 is the first resistance worth watching, with a longer-range target near $0.00000725 if buyers stay in control.
Nothing guaranteed here, but the structure favors the upside for now.
Fail to hold this breakout, though, and the price likely slips back toward the demand zone. Support sits at $0.00000455, and a deeper pullback could test $0.00000413 before buyers get another shot.
Bull, Base, and Bear Scenarios
What changes this? The bull case weakens if SHIB can't reclaim $0.00000520 on a retest. The bear case weakens if the price holds $0.00000482 and starts pushing back up.
Market Context
$SHIB's market cap alone doesn't tell the full story here. Even at roughly $2.9 billion, the token still trades close to 94% below its all-time high from October 2021.
That gap matters for a price target conversation because a large market cap built on a massive token supply behaves differently than one built on scarcity; gains that look modest in percentage terms can still mean real upside in dollar terms, and vice versa on the way down.
BTC dominance and broader risk appetite still set the tone for where meme coins like SHIB go from here, and SHIB's ETH correlation through the wider altcoin market adds another layer worth watching alongside the charts.
Glossary
Symmetrical Triangle: One line sliding down, another climbing up, boxing price into a shrinking range. Something's got to give eventually.
Trendline Breakout: Price finally closes past a line that had been holding it back for a while. Often the first hint of direction is shifting.
Demand Zone: A spot where buyers have shown up before and turned a slide back around. Traders keep an eye out for it happening again.
Liquidation: A leveraged position getting closed out by force once losses chew through the margin backing it. No choice involved.
Methodology: This analysis is based on technical chart patterns read from TradingView, along with liquidation and exchange volume data sourced from Coinglass, all as of the time of writing. Price levels are derived directly from the charts referenced, with no extrapolation beyond what the structures show.
Disclaimer: This shiba inu price prediction is for informational purposes only and does not constitute financial advice. Cryptocurrency markets, especially meme coins with large supplies like SHIB are highly volatile and speculative. Always conduct independent research and consider your own risk tolerance before making any investment decisions.


















