Shiba Inu Price Prediction: SHIB Just Hit Its Most Important Level Yet

Shiba Inu emerged in 2020 as an Ethereum-based meme token and has since grown into one of the most actively traded assets in the sector, supported by a large retail holder base and an ongoing token-burn mechanism.
This Shiba Inu price prediction examines where the coin stands today and what the hourly chart suggests comes next.
Shiba Inu price today is $0.00000547, up 3.5% over the past 24 hours, with the token's market capitalization sitting close to $3.269 billion.
The 24-hour range has stayed narrow between $0.00000532 and $0.00000584, reflecting the same consolidation pattern visible on the hourly chart.
Live Market Data
Metric | Value |
Price | $0.00000547 |
24h Change | +3.5% |
Market Cap | $3.269B |
Fully Diluted Valuation | $3.27B |
24h Trading Volume | $81.505M |
Circulating Supply | 589.239T |
Total Supply | 589.496T |
Liquidation Data
Short positions have taken the bulk of the pressure over the shortest timeframes, though the picture balances out over the full day.
Timeframe | Total Liquidated | Longs | Shorts |
1H | $10.61K | $0 | $10.61K |
4H | $10.61K | $0 | $10.61K |
12H | $41.16K | $22.57K | $18.59K |
24H | $53.90K | $24.47K | $29.43K |
Source: Liquidation Data Taken From CoinGlass.
Shorts have been squeezed hard in the most recent hours, with zero long-side liquidations on both the 1H and 4H windows.
Over the fuller 24-hour period, the split becomes more even, with longs accounting for $24.47K against $29.43K in shorts, suggesting the market has been choppier than the tight hourly range might otherwise imply.
Exchange Volume
Trading volume for $SHIB remains spread across several mid-sized exchanges rather than concentrated on one platform. 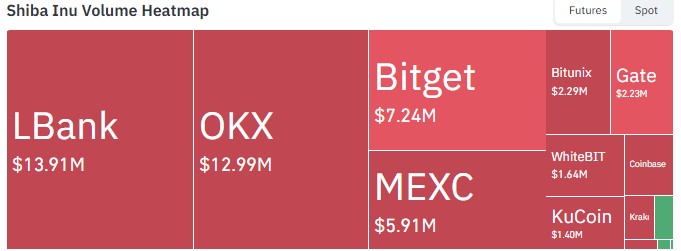
Source: Volume Heatmap Data Taken From CoinGlass, As of Sept 21, 2026.
LBank leads with $13.91M in 24-hour volume, closely followed by OKX at $12.99M. Bitget adds $7.24M, MEXC contributes $5.91M, and Bitunix and Gate each add roughly $2.2M.
This distribution across multiple venues points to broad-based retail interest rather than volume driven by a single exchange.
Shiba Inu News Today
Shibburn, the platform that tracks Shiba Inu's token-burn activity, reported that 9,035,570 SHIB tokens were burned in the past 24 hours, worth roughly $49.43 at current prices. 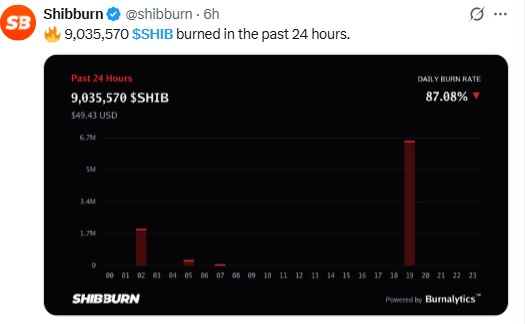
Source: Data Taken From @shibburn, X Account, as of Sep 21, 2026
The daily burn rate was recorded at 87.08%, down from the prior period, indicating burn activity has cooled somewhat even as price has moved higher. 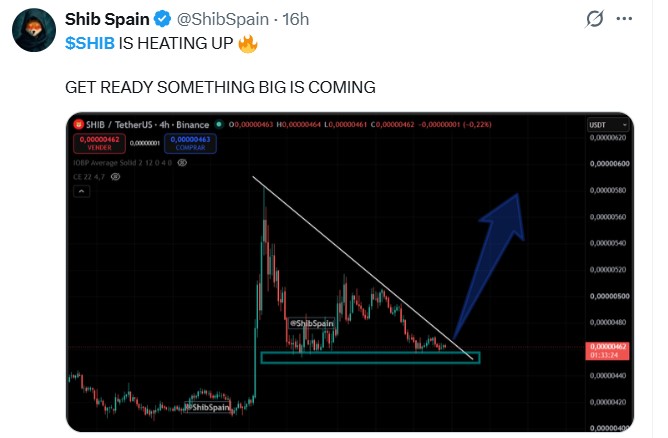
Source: Data Taken From @ShibSpain, X Account, as of Sep 21, 2026
Separately, chatter among SHIB-focused trading accounts has picked up on social media, with some pointing to the current trendline setup as a potential turning point, though such commentary should be treated as general sentiment rather than a confirmed signal until the trendline actually breaks with volume.
Shiba Inu Technical Analysis
Shiba Inu technical analysis on the 1-hour SHIBUSDT chart (Binance, candle closed 12:20 UTC+5:30, September 21, 2026) shows price trading just below a falling trendline that has capped rallies since September 17. 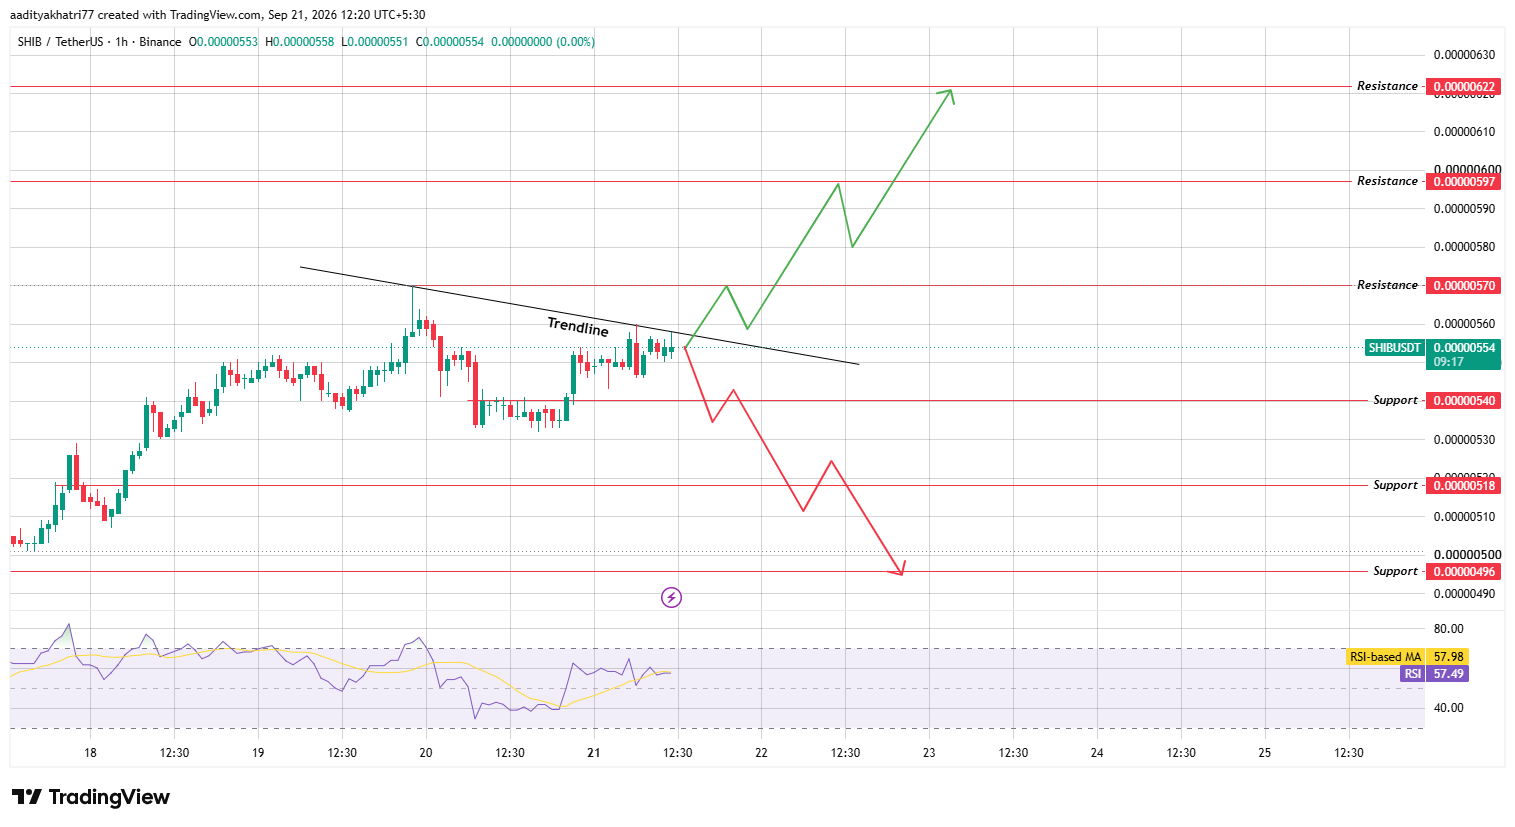
Source: Chart taken from TradingView, as of Sep 21, 2026
The RSI reads 57.49, just under its moving average of 57.98, indicating momentum is balanced rather than leaning firmly in either direction at this exact point.
Shiba Inu Price Prediction: Bullish Case On a Trendline Break
If SHIB closes above the falling trendline on a candle backed by rising volume, the first resistance to watch is $0.00000570.
A break there opens the path toward $0.00000597, and a confirmed move through that zone puts $0.00000622 within reach.
This scenario would mark a shift away from the recent downtrend and signal renewed buying interest.
Shiba Inu Price Prediction: Bearish Case on a Rejection
A rejection from the trendline changes the setup quickly. The first support to watch is $0.00000540, and a break there would open a path toward $0.00000518.
Should that level also fail, a deeper slide toward $0.00000496 becomes the next downside target, extending the current consolidation into a fresh leg lower.
Support & Resistance Levels
Support | Resistance |
$0.00000540 | $0.00000570 |
$0.00000518 | $0.00000597 |
$0.00000496 | $0.00000622 |
Bull, Base, and Bear Scenarios
Scenario | Setup | Level |
Bull | Hourly close above the falling trendline with rising volume | $0.00000570 – $0.00000622 |
Base | Price holds near the trendline and ranges between support and resistance. | $0.00000540 – $0.00000570 |
Bear | Rejection from trendline, candle closes below $0.00000540 | $0.00000518 – $0.00000496 |
Shiba Inu vs Bitcoin
SHIB's price action has largely mirrored Bitcoin's broader trend over the past week, with both assets moving through similar periods of consolidation.
When Bitcoin holds its key support zones, higher-beta tokens like Shiba Inu tend to get more room to attempt trendline breaks rather than facing outsized selling, which adds some context to the current setup.
Methodology
This Shiba Inu price prediction is based on 1-hour candle data from Binance via TradingView, combined with live liquidation and volume data from CoinGlass and market data from CoinGecko.
Support and resistance levels are drawn from prior price reactions on the chart, and the RSI reading is used to gauge whether momentum favors a breakout or a rejection at the trendline.
No price target here should be treated as guaranteed; SHIB's low unit price makes it prone to sharp percentage swings, and traders should manage risk accordingly.
Expert Opinion
Analysts following $SHIB's hourly structure note that repeated tests of a falling trendline without a decisive breakdown often reflect building buyer interest underneath the surface, a pattern that can precede a sharp move once the trendline is finally broken with confirming volume.
Disclaimer: This article is for informational purposes only and does not constitute financial advice. Cryptocurrency markets are highly volatile, and SHIB's price can move against any technical setup discussed here. There is a real possibility that the coin fails to reach any of the projected levels or moves in the opposite direction entirely. Readers should conduct their own research and consult a qualified financial advisor before making investment decisions.


















