Stellar Price Prediction: Does BoE News Fuel a Breakout for XLM?


A quiet piece of institutional news has given Stellar's community something fresh to talk about this week, arriving at almost the exact moment the chart itself is approaching a decision point.
Whether the two line ups could matter a great deal for near-term stellar price prediction 2026 discussions.
Stellar was launched in 2014 as a network built for fast, low-cost cross-border payments, positioning itself as infrastructure for institutions and payment providers rather than purely a retail trading asset.
That institutional focus has remained part of its identity ever since, and it is part of why partnership or integration news tends to draw outsized attention from the XLM price prediction community.
Stellar price today is $0.1916, up 3.9% over the past 24 hours, having traded within a range of $0.1833 to $0.1967 during that window.
The current market capitalization is near $6.673 billion, keeping Stellar among the more actively tracked large-cap payment-focused tokens.
Live Market Data
Metric | Value |
Price | $0.1916 |
24h Change | +3.9% |
24h Range | $0.1833 - $0.1967 |
Market Cap | $6.673B |
Fully Diluted Valuation | $9.577B |
24h Trading Volume | $376.038M |
Circulating Supply | 34.84B |
Total Supply | 50.002B |
Max Supply | Unlimited |
Source: XLM market data taken from CoinGecko, as of Sep 15, 2026. Figures may vary slightly across other tracking websites.
Exchange Volume
Trading activity in Stellar remains concentrated on a handful of major venues. Binance leads by a wide margin with $142.39 million in 24-hour volume, followed by Bybit at $42.82 million and OKX at $36.20 million. 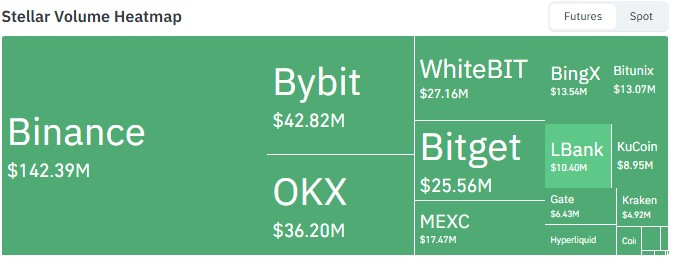
Source: Volume Heatmap Data Taken From CoinGlass, As of Sept 15, 2026.
WhiteBIT contributes $27.16 million, Bitget adds $25.56 million, and MEXC brings in $17.47 million. Smaller but still notable volume comes from BingX, Bitunix, LBank, KuCoin, Gate, Kraken, Hyperliquid, and Coinbase.
The heavy concentration on Binance suggests most short-term price discovery for XLM continues to happen on the largest centralized order books.
Liquidation Data
Timeframe | Total Liquidated | Longs | Shorts |
1 Hour | $12.43K | $12.43K | $0 |
4 Hours | $57.02K | $32.41K | $24.62K |
12 Hours | $118.95K | $74.92K | $44.02K |
24 Hours | $328.98K | $119.37K | $209.60K |
Source: Liquidation Data Taken From CoinGlass, As of Sept 15, 2026.
The shift across these windows is worth noting. In the shortest one-hour window, every liquidated position was a long, but over the fuller 24-hour period, short positions accounted for the larger share at $209.60K against $119.37K in longs.
That reversal suggests short sellers were caught off guard by the broader move higher over the past day, even as some longs were flushed out during shorter-term pullbacks within that same period.
Stellar News Today
A report circulating this week revealed that Stellar was used in a stablecoin clearing prototype integrated with the Bank of England's real-time gross settlement test environment.
According to the post, a firm called Nuvanté built the prototype on $XLM and tested it against the central bank's next-generation infrastructure. 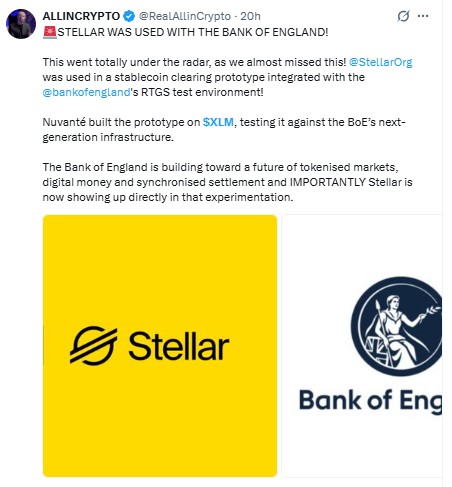
Source: Data Taken From @RealAllinCrypto, X Account, as of Sep 15, 2026
The Bank of England has been building toward a future involving tokenized markets, digital money, and synchronized settlement, and Stellar's direct appearance in that experimentation was described as having gone largely unnoticed until now.
News of this kind tends to reinforce Stellar's positioning as payment-focused infrastructure rather than a purely speculative asset, and it likely contributed to the token's stronger 24-hour performance.
Stellar Price Prediction: Technical Analysis
The daily XLM/USDT chart on Binance shows price inside a symmetrical triangle, with a falling trendline from the late-August highs converging against a rising trendline built from the September lows. 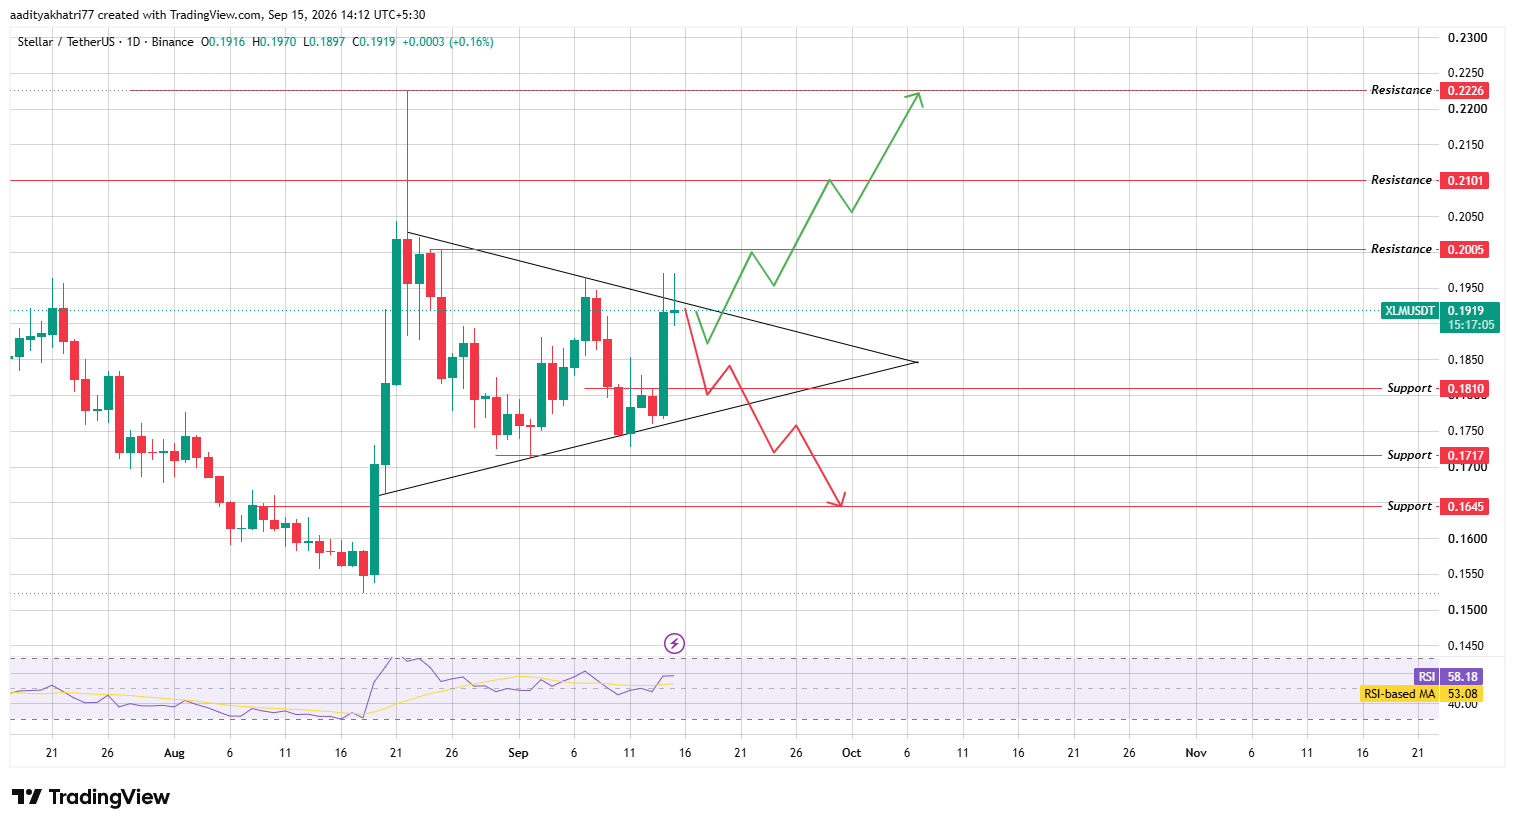
Source: Chart taken from TradingView, as of Sep 15, 2026
The price is currently sitting right on that falling trendline.
The most recent daily candle is running at $0.1919, up 0.16% on the session, with the Relative Strength Index at 58.18, above its 53.08 moving average, pointing to modestly improving momentum.
This triangle sits at the center of the current XLM price prediction, since symmetrical triangles typically resolve with a decisive move once one of the two trendlines gives way.
Can $XLM Break the Falling Trendline and Push Higher?
A confirmed daily close above the falling trendline, backed by strong volume, would open the path toward $0.2005.
Clearing that level with continued strength could extend the move toward $0.2101, and a sustained break beyond that resistance would put $0.2226 in view, a scenario that could gain extra support if the Bank of England story continues to draw attention.
What Happens If $XLM Gets Rejected From the Falling Trendline
If the price is instead rejected at the falling trendline, the setup would likely drift back toward the rising trendline underneath.
A confirmed break of that rising trendline would open the door to $0.1810 first, with further downside risk toward $0.1717 and then $0.1645 among the key $XLM price levels to watch if selling pressure builds.
Support and Resistance Levels
Support | Resistance |
$0.1810 | $0.2005 |
$0.1717 | $0.2101 |
$0.1645 | $0.2226 |
Bull, Base, and Bear Scenarios
Scenario | Setup | Level |
Bull | Falling trendline break with volume confirmation | $0.2005 - $0.2226 |
Base | Consolidation inside the symmetrical triangle | $0.1810 - $0.2005 |
Bear | Confirmed break of the rising trendline | $0.1717 - $0.1645 |
Stellar vs Bitcoin
Stellar's BTC-denominated value rose roughly 5.2% over the past 24 hours, outpacing its own 3.9% dollar-denominated gain, which suggests $XLM outperformed Bitcoin over this stretch.
That kind of relative strength is often linked to token-specific catalysts, and the Bank of England news likely played a role here.
Anyone tracking Bitcoin price today alongside $XLM should note that continued Bitcoin strength would likely make it easier for Stellar to clear its falling trendline, while a weaker Bitcoin tape could pull $XLM back toward the rising trendline support instead.
Methodology
This stellar price prediction is based on the daily XLM/USDT chart on Binance, cross-checked against live market data, exchange-level trading volume, and liquidation figures pulled at the time of writing.
Support and resistance levels were taken directly from the chart's marked trendline and horizontal structures rather than estimated, and the RSI reading was drawn from the same daily timeframe used for the pattern analysis.
Scenario outcomes described above depend on confirmed candle closes and volume behavior rather than intraday wicks, and none of the levels discussed should be treated as guaranteed given how quickly sentiment around the stellar price prediction september 2026 can shift.
Expert Opinion
Commentary around Stellar this week has centered on what the Bank of England prototype news means for the network's longer-term institutional positioning, with some observers framing it as evidence that Stellar continues to attract real-world settlement experimentation rather than only retail trading interest.
Others cautioned that a prototype test is an early-stage signal rather than a confirmed adoption event and that its direct near-term price impact should not be overstated.
The broader view remains that the triangle resolution on the daily chart will likely matter more for the next few weeks than the news alone.
Disclaimer: This article is for informational purposes only and should not be considered financial advice. Cryptocurrency markets, including Stellar, are highly volatile, and the scenarios outlined above carry meaningful downside risk. Prices can move against any of the levels discussed here, and readers should conduct their own research and consult a qualified financial advisor before making investment decisions.












.jpg)





