XRP Price Prediction: Tight Coiling Pattern Hints at a Big Breakout


XRP is trading close to $1.09 today, locked inside one of its tightest price ranges in months. Traders are watching closely, since a squeeze this tight often ends with a sharp move in either direction.
The chart looks like a coiled spring right now. Price barely moves day to day, but pressure appears to be building underneath the surface.
Why Is XRP Price Coiling So Tightly Right Now?
Market analyst Xaif Crypto flagged a few signals happening at the same time. Long and short traders are both getting liquidated again and again. That is unusual, and it shows neither side can hold control for long.
The 14-day trading range has also shrunk hard. XRP has not made a big directional move in weeks, even as trading activity continues underneath.
Funding rates on futures have gone flat too. That means traders are not leaning bullish or bearish as a group. Nobody wants to pick a side just yet.
Spot liquidity on Binance has thinned out since mid-June as well. A thin order book, a tight range, and creeping leverage together often show up right before a fast move.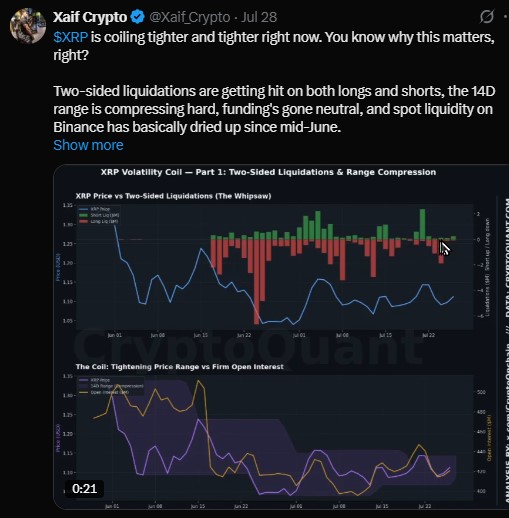
What Do XRP ETF Inflows Show About Demand?
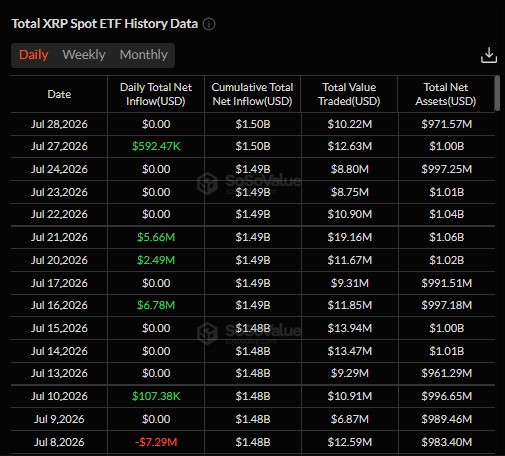
Spot XRP ETF data adds another layer to the picture. As of July 28, 2026, cumulative net inflows sit near $1.50 billion, with total net assets close to $971.57 million.
Daily flows have been choppy through July. Many days showed zero net flow, but a few stood out. July 16 brought in $6.78 million, and July 21 added $5.66 million.
Not every day was positive. July 8 recorded a net outflow of $7.29 million, a reminder that ETF demand can swing in both directions.
Date | Daily Net Inflow | Cumulative Net Inflow | Total Net Assets |
Jul 28, 2026 | $0.00 | $1.50B | $971.57M |
Jul 27, 2026 | $592.47K | $1.50B | $1.00B |
Jul 24, 2026 | $0.00 | $1.49B | $997.25M |
Jul 23, 2026 | $0.00 | $1.49B | $1.01B |
Jul 22, 2026 | $0.00 | $1.49B | $1.04B |
Jul 21, 2026 | $5.66M | $1.49B | $1.06B |
Jul 20, 2026 | $2.49M | $1.49B | $1.02B |
Jul 17, 2026 | $0.00 | $1.49B | $991.51M |
Jul 16, 2026 | $6.78M | $1.49B | $997.18M |
Jul 15, 2026 | $0.00 | $1.48B | $1.00B |
Jul 14, 2026 | $0.00 | $1.48B | $1.01B |
Jul 13, 2026 | $0.00 | $1.48B | $961.29M |
Jul 10, 2026 | $107.38K | $1.48B | $996.65M |
Jul 9, 2026 | $0.00 | $1.48B | $989.46M |
Jul 8, 2026 | -$7.29M | $1.48B | $983.40M |
How Does the CLARITY Act Delay Affect XRP?
Regulation is another piece of this setup. The Senate has pushed back the Digital Asset Market Clarity Act again, choosing to deal with a Russia sanctions bill and a batch of nominations first.
Majority Leader John Thune is steering the chamber toward that sanctions bill, and recess begins around August 8. That leaves a narrow window for crypto market structure rules this session.
A delay like this does not doom the token's prospects, but it does remove a catalyst traders had hoped for. Near-term regulatory clarity now looks less likely in the short run.
XRP Price Prediction: What Does the Symmetrical Triangle Pattern Mean for XRP?
XRP is also consolidating inside a symmetrical triangle on the daily chart. This pattern forms from lower highs and higher lows, and it usually points to shrinking volatility ahead of a breakout.
The token is trading near $1.09, with the 20-day EMA acting as immediate support. The 50, 100, and 200 day EMAs all sit above the current price, which shows the broader trend is still cautious.
A confirmed daily close above the triangle's upper trendline and the $1.13 to $1.15 resistance zone could trigger bullish momentum. That kind of move could open the door toward $1.22, and then $1.28 to $1.30 after that.
On the downside, a break below ascending support near $1.05 could bring in more selling pressure. Downside targets in that case sit around $1.00, and then $0.95.
As the triangle nears its apex, traders are watching for a high-volume breakout. That move is likely to decide XRP's next big directional swing.
What Could Push XRP Price Higher or Lower From Here?
All the pieces point the same way: a market waiting on a trigger. The coiling range, the mixed ETF flows, the stalled CLARITY Act, and now the triangle all describe the same standoff from different angles.
The $1.13 to $1.15 zone is the level to watch on the upside. A daily close above it, backed by real volume, is what would confirm the bulls have taken over, with $1.22 and then $1.28 to $1.30 as the next stops.
A break below $1.05 would flip that story. That is where the downside case opens up, with $1.00 and $0.95 as the levels bears would likely target next.
Until one of those levels breaks with volume behind it, XRP is still coiling. Traders watching the token right now are keeping an eye on that breakout level, funding rates, and whether ETF inflows turn consistently positive again in the coming weeks.
Disclaimer
This article is for general information only and is not financial advice. Always do your own research before making investment decisions.









.jpg)








