Zcash Price Prediction: Can Buyers Break the $547 Barrier?


Zcash Price Prediction is back in focus as buyers and sellers fight around one of the clearest decision zones on the daily chart. $ZEC has already recovered sharply from its earlier base.
But the latest pullback shows that buyers are not getting a free run higher.
A rising trendline is still supporting the broader structure while repeated selling near the upper boundary keeps the market compressed.
That leaves Zcash in an awkward spot: the trend has improved, but the breakout has not arrived.
With price now sitting between nearby support and the $547 barrier, the next confirmed move could decide whether the recovery extends or starts to unwind.
Why Is the Zcash Price Prediction at a Turning Point?
The latest CoinMarketCap data shows ZEC at $521.46, down 4.76% over 24 hours. Market cap stands near $8.75 billion, while daily volume is around $430.71 million, down 8.14%.
The circulating supply is 16.78 million $ZEC against a maximum supply of 21 million.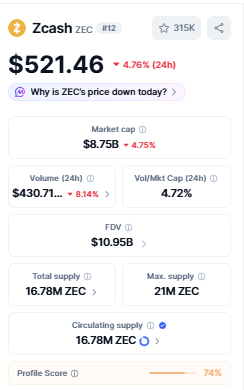 The price decline matters because it has pulled ZEC back below the first resistance marked on the chart without destroying the rising structure underneath.
That creates a genuine test of demand. Buyers still have room to defend the setup, But they need to stop the current weakness from turning into a deeper loss of support.
Source: Data from CoinMarketCap as of 22/07/2026. Figures may vary slightly across other tracking websites.
What Does the $ZEC Ascending Triangle Show on the Daily Chart?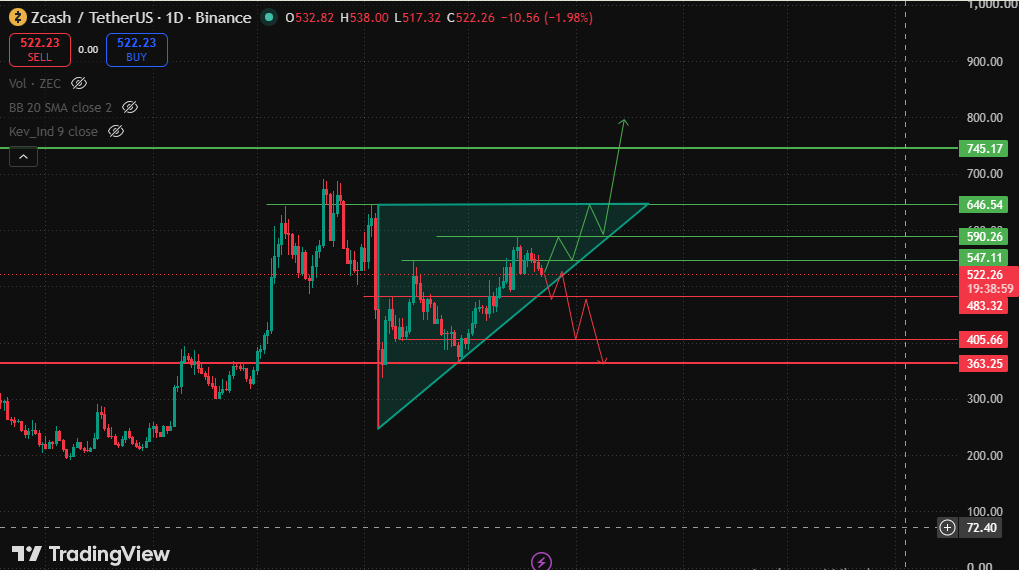
The daily TradingView chart shows an ascending structure built around a rising support line and a broad ceiling near $646.54.
Inside that larger formation, price is now testing a more immediate battle zone around $547.11.
A recovery above $547.11 would be the first sign that buyers are regaining momentum.
The next level sits at $590.26, followed by the larger $646.54 resistance. If ZEC eventually clears that ceiling with follow-through, the chart leaves room toward $745.17.
The structure is constructive, but it is not a confirmed breakout. Price remains below the first trigger, which means buyers still have work to do before the higher targets become technically relevant.
Could Zcash Development Give Buyers a Stronger Narrative?
There is no need to force a breaking-news catalyst into the current move, but Zcash does have an active technical backdrop.
Project Tachyon recently detailed Ironwood, a proposed shielded protocol designed to strengthen supply auditing and improve assurance around private transactions. The project remains subject to community approval before any network activation.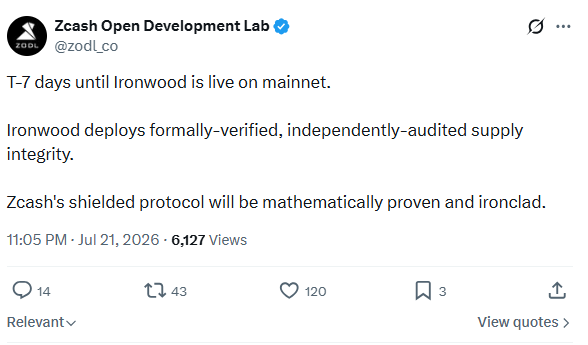
That development is relevant because privacy technology and protocol security remain central to the Zcash investment story. This information is also confirmed by Sheild Labs on their official website.
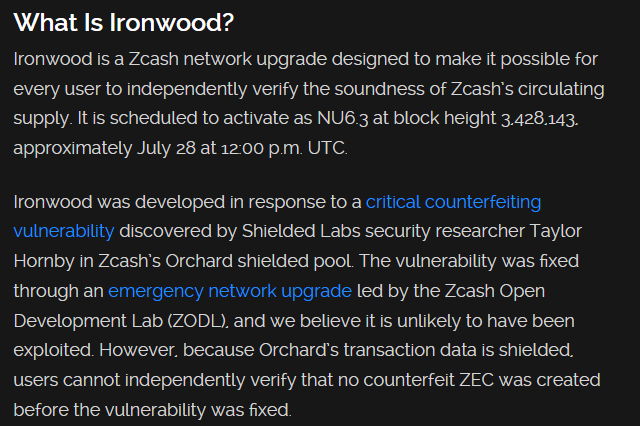
Source: Data from shieldedlabs.net as of 22/07/2026.
It should not, however, be presented as the direct cause of today's price action.
The cleaner interpretation is that protocol development continues while the market decides whether the recent recovery has enough demand behind it to challenge higher resistance.
What Is the ZEC Derivatives Market Adding to the Setup?
ZEC’s derivatives market is leaning defensive as price struggles below resistance.
CoinGlass data shows $2.02 million in liquidations over the past 24 hours, with long positions accounting for $1.62 million, compared with $400,700 in short liquidations.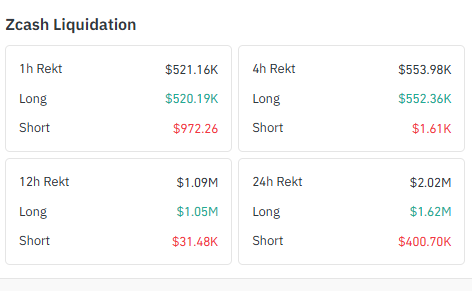
That imbalance shows bullish leveraged traders took most of the damage during the latest pullback.
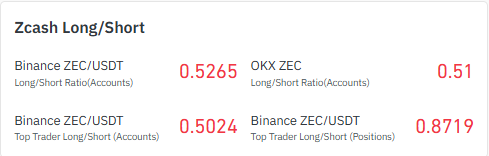
Positioning remains cautious as well. The Binance ZEC/USDT account Long/Short Ratio stands at 0.5265, while OKX is at 0.51, both pointing to more short accounts than long accounts.
Binance's top-trader data tells a similar story — the long-short ratio sits right around 1, and funding rates across the board are hovering near zero with just a touch of negative lean. The current OI data is $1.06 billion.
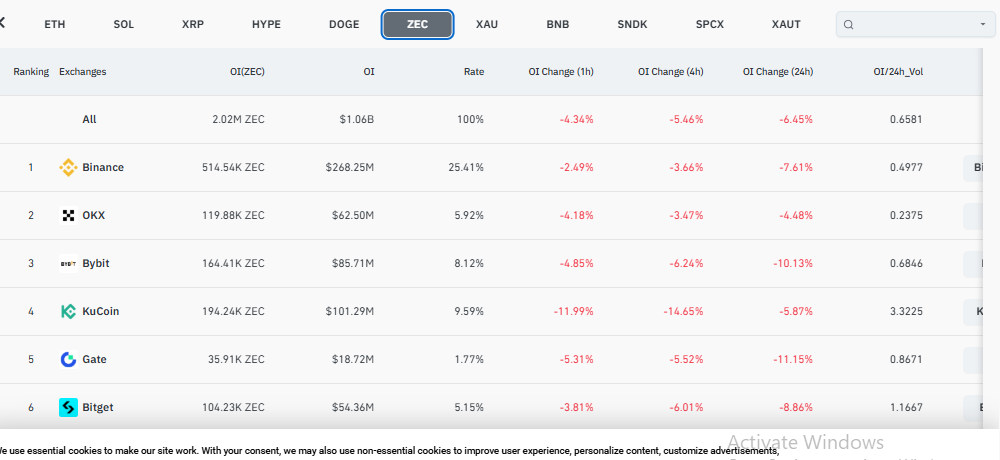
For the current Zcash Price Prediction, that creates an interesting tension. Derivatives traders are leaning bearish while the daily chart still holds its broader rising structure.
Source: Data from coinglass as of 22/07/2026. Figures may vary slightly across other tracking websites.
Zcash Price Outlook: Can ZEC Reach $646 Next?
A move toward $646.54 is possible, but the chart does not support jumping directly to that target yet.
$ZEC first needs to reclaim $547.11 and then clear $590.26. Those levels are the checkpoints that would show whether buying pressure is actually strengthening.
If both barriers turn into support, the larger ascending structure becomes more convincing, and $646.54 returns as the main breakout test. A clean move above it could open the route toward $745.17.
The opposite path remains active. Rejection below $547.11 followed by a break under $483.32 would shift momentum toward sellers and make $405.66 increasingly relevant.
Confirmation matters more than prediction while ZEC trades between these boundaries.
What Could Invalidate the Bullish Zcash Price Prediction?
The bullish argument weakens first if ZEC loses $483.32 and fails to recover it.
That would break an important layer of support beneath the current price and increase the risk of a move toward $405.66. A deeper breakdown could eventually put $363.25 back in focus.
What happens outside Zcash matters too.
If Bitcoin and the major altcoins see a sharp risk-off move, ZEC could get dragged down with them even if its own chart is holding support for now.
And there's the leverage angle with positioning this crowded; a wave of liquidations could easily speed up whatever move comes next.
The current setup therefore remains balanced: buyers have a rising structure to defend, but sellers still control the immediate resistance zone.
What Is the Expert View on the Current ZEC Setup?
CoinGabbar market analysts would likely describe the ZEC setup as constructive but unfinished.
The broader chart has developed rising support, yet the price remains below the levels required to confirm another leg higher. The 24-hour decline also shows that sellers are still active around the current range.
The strongest bullish evidence would come from price reclaiming $547.11 and holding above $590.26. The strongest bearish evidence would be a loss of $483.32 followed by continued selling pressure.
For now, the ZEC Price Prediction depends on which side wins that range.
The technicals lay out a fairly clear roadmap, but the protocol upgrades and derivatives activity only add context; they don't guarantee anything.
Disclaimer: This article is for informational and educational purposes only and should not be considered financial or investment advice. Cryptocurrency markets are highly volatile, and prices can change rapidly. Readers should conduct their own research and consult a qualified financial professional before making investment decisions.
Also read:

















