Zcash Price Prediction: Can $ZEC Hit New High Next?


Zcash is exploding $ZEC just smashed past $1,242 with 24-hour volume up over 50%, and traders are calling for a straight shot to $2,200 off a massive cup and handle breakout.
The neckline just broke, and the FOMO could get violent if the move holds. Meanwhile, NEAR Protocol is spotlighting Zcash as one of its core integrated chains.
Is this Zcash price prediction rally about to go parabolic?
Market data was checked on September 10, 2026, at 10:56 IST.
$ZEC Price Prediction Today: Market Overview
| Metric | Value |
| Price | $1,235.67 |
| 24h Change | +3% |
| Market Cap | $20.94B (+0.02%) |
| FDV | $26.08B |
| 24h Volume | $1.88B (+50.27%) |
| Vol/Mkt Cap (24h) | 9.06% |
| Total Supply | 16.86M |
| Max Supply | 21M |
| Circulating Supply | 16.86M |
Source: Data from CoinMarketCap as of September 10, 2026, at 10:56 IST. Figures may vary slightly across other tracking websites.
ZEC Crypto News Today: Cup and Handle Breakout Eyes $2,200
Trader posted that $ZEC's weekly cup and handle pattern has broken above its neckline, with a measured move projecting toward $2,200+.
The post frames the $650 zone as the neckline and $2,200 as the pattern target, while raising the question of whether $ZEC continues straight up or retests the neckline first. 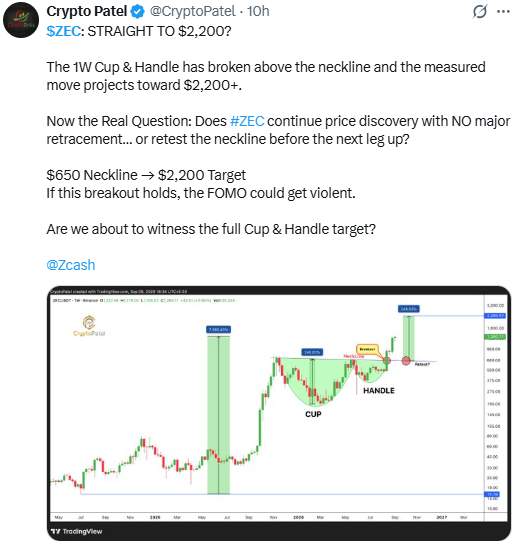
Source: Data From X
This price target is a social-media-sourced claim and should be treated as an allegation rather than a confirmed forecast.
Zcash News: NEAR Protocol Highlights Cross-Chain Integration
NEAR Protocol's official account called out Zcash as one of three chains tied into its "Three Chains, One Account" push, framing ZEC as part of a broader confidential, chain-abstracted asset experience alongside NEAR and Base-based VVV. 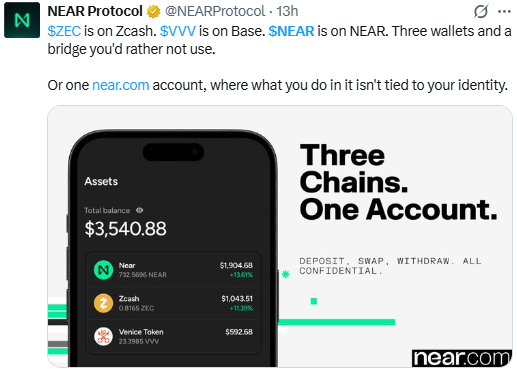
This is more ecosystem visibility than a price signal, but it adds to the narrative fueling attention on $ZEC right now.
ZEC Price Prediction Chart: Technical Analysis
Pair: ZEC/USD · Market: Spot (Crypto) · Exchange: TradingView · Timeframe: 1D · Timestamp: September 10, 2026, 10:56 IST
$ZEC opened at $1,244.50, ran to a high of $1,254.29, dipped to $1,206.21, and closed at $1,235.67, up 3% on the day after a massive multi-week rally.
Price broke sharply above a long-standing descending trendline in late August and has since cleared every major Fibonacci retracement level drawn from the recent swing low to high, currently consolidating just under the $1,253.32 resistance line.
The EMA20 sits far below at $963.10, with the EMA50 even lower at $766.15, both reflecting how fast this move has outpaced its own trend.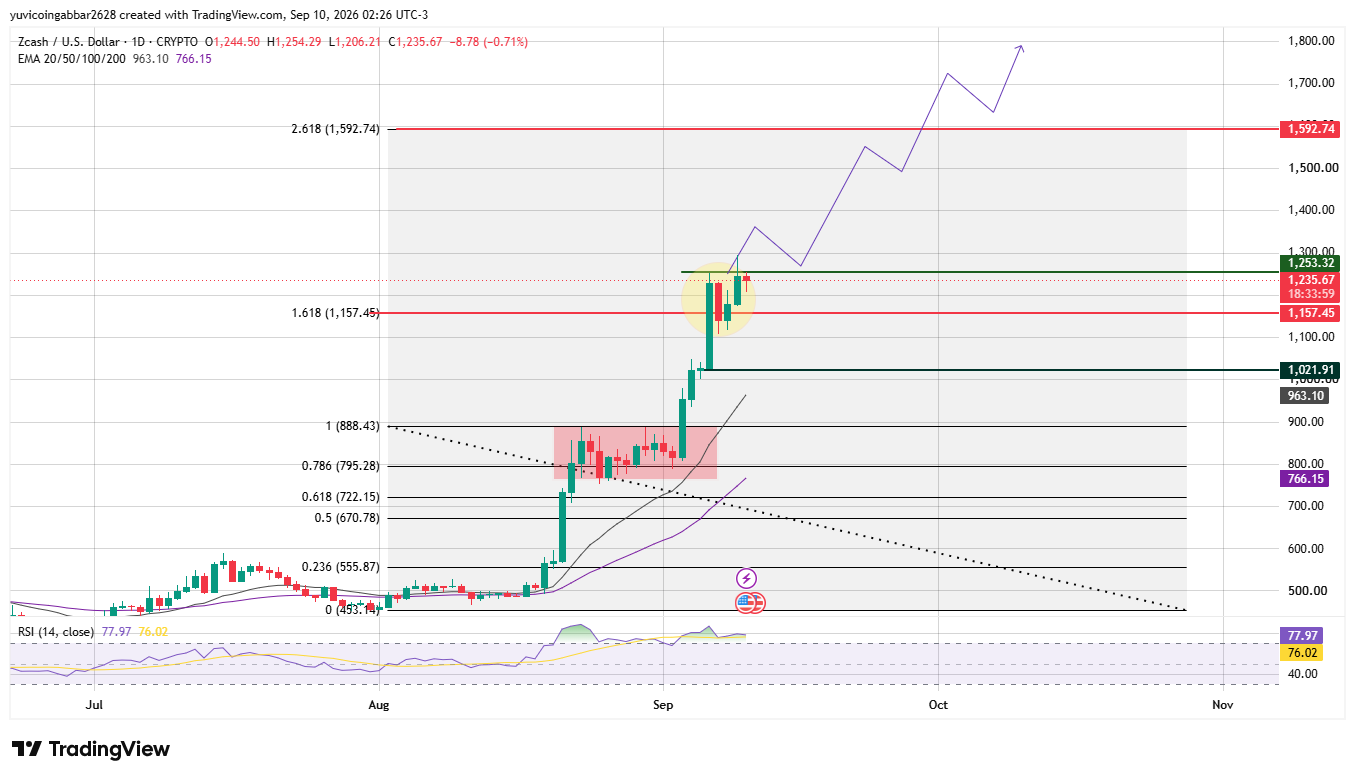
Support and Resistance Levels
| Level Type | Price |
| Resistance 2 (Fib 2.618 extension) | $1,592.74 |
| Resistance 1 (nearest) | $1,253.32 |
| Immediate Price Reference | $1,235.67 |
| First Confirmed Support (Fib 1.618) | $1,157.45 |
| Deeper Support | $1,021.91 |
| Structural Floor (Fib 1.0) | $888.43 |
ZEC Forecast: Bull Case vs Bear Case
Bull case: Holding above $1,157.45 and clearing the nearest resistance at $1,253.32 would keep the breakout structure intact and open room toward the $1,592.74 extension level.
The wide gap to both EMAs shows plenty of trend room left before the move looks stretched.
Bear case: A rejection at $1,253.32 followed by a slide back below $1,157.45 would suggest the parabolic leg is cooling off.
Losing $1,021.91 would put the whole recent breakout structure at risk and expose $888.43 as the next real test.
$ZEC Price Scenarios: Triggers and Invalidation
| Scenario | Trigger | Likely Outcome | Invalidation Point |
| Continuation | Close above $1,253.32 | Move toward $1,592.74 | Close back below $1,157.45 |
| Consolidation | Range between $1,157.45 and $1,253.32 | Sideways chop before next leg | Break of either boundary |
| Reversal | Close below $1,021.91 | Slide toward $888.43 | Reclaim of $1,157.45 |
Can $ZEC Reach $1,592.74?
$1,592.74 is the highest resistance level marked on the chart, the 2.618 Fibonacci extension.
Reaching it would require ZEC to first clear the nearest resistance at $1,253.32 and hold above it, since this level has already capped the price twice in the past week.
ZEC Price Prediction: Bitcoin's Role in the Bigger Picture
Broader market conditions still matter for a move this size. Most Bitcoin price prediction outlooks for the current cycle see Bitcoin holding steady as a key condition for altcoins like ZEC to keep extending sharp breakouts, since a sudden Bitcoin drop tends to pull high-momentum names like ZEC down hard and fast.
ZEC Price Prediction 2026: Expert View
According to CoinGabbar analysts , ZEC's move from under $500 to above $1,200 in a matter of weeks is an outsized trend, and the $1,157.45 to $1,253.32 zone is now the key battleground for whether that continues cleanly or cools off first.
Disclaimer: This piece is for informational purposes only and isn't financial advice. The levels and scenarios above are based on technical chart analysis and publicly available data at the time of writing, and crypto markets can move sharply within hours, so past patterns don't guarantee future outcomes. It's worth doing independent research and considering your own risk tolerance before acting on any of the levels discussed here.

















