BLUECHIP price prediction 2026-2030: How High Can BLUECHIP Go?


BLUECHIP just ripped higher on the four-hour chart, and traders are asking the obvious question. Where does it go next? This BLUECHIP price prediction walks through the live numbers, the current trend, and the support and resistance levels that matter most for 2026 through 2030, along with the reasoning behind each target.
Quick Prediction Box
BLUECHIP is trading near $0.01904, up roughly 42-47% in the past 24 hours as of 10 September 2026, 09:00 UTC. Momentum is bullish but stretched, and the next real test sits at the resistance band above.
Metric | Current View |
Current Price | $0.01904 |
Trend | Bullish |
Next Target | $0.02992 (Fib 1.0) |
Support | $0.01528 (EMA 50) / $0.01057 |
Resistance | $0.01961 / $0.02992 |
RSI | 59.04 (neutral-bullish) |
Bull Case | Break above $0.02992 opens $0.04160 |
Base Case | Range holds between $0.01528 and $0.01961 |
Bear Case | Loss of $0.01528 drags price to $0.01057 |
Invalidation | Daily trading below $0.01057 |
Blue Chip Price Prediction: What Traders Need to Know
This move didn't come out of nowhere. BLUECHIP printed a sharp green candle on the 4H chart and hasn't fully given it back.
Current price: $0.01904, per live BLUECHIP market data.
24H move: up between 42% and 47%, depending on the source snapshot.
Market cap: near $19.45 million, fully diluted at the same figure since supply is fully unlocked.
Volume: 24H trading volume sits around $7.27 million on aggregated exchanges, with roughly $3.1 million tracked on the primary base pool.
Trend: bullish, but momentum has cooled since the initial spike. It's not falling apart, though.
Immediate target: the Fibonacci 1.0 extension at $0.02992.
Support: the 50-period EMA at $0.01528, backed by a deeper zone near $0.01057.
Resistance: local swing high at $0.01961, then the extension levels above it.
BLUECHIP Price Prediction Today and Next 7 Days
BLUECHIP Price Prediction Today
Today's trading range has been tight. The price opened near $0.01831, tagged a high of $0.01961, and hasn't broken decisively either way.
Anyone watching for a catalyst should keep an eye on the coin events calendar, since scheduled announcements often move thin-liquidity tokens fast.
And that matters. A tight range after a big candle usually means the market's deciding what the move was worth.
BLUECHIP Price Prediction Tomorrow
If trading holds above the EMA 50 line, expect another push toward $0.01961 and possibly $0.02000. A rejection there sends price back toward $0.01700.
BLUECHIP Price Prediction Next 7 Days
Over the coming week, BLUECHIP is likely to either consolidate under $0.02000 and build a base, or break out toward the $0.02992 extension. Volume needs to confirm either path.
The chart does not lie.
Blue Chip Technical Analysis
BLUECHIP Support Levels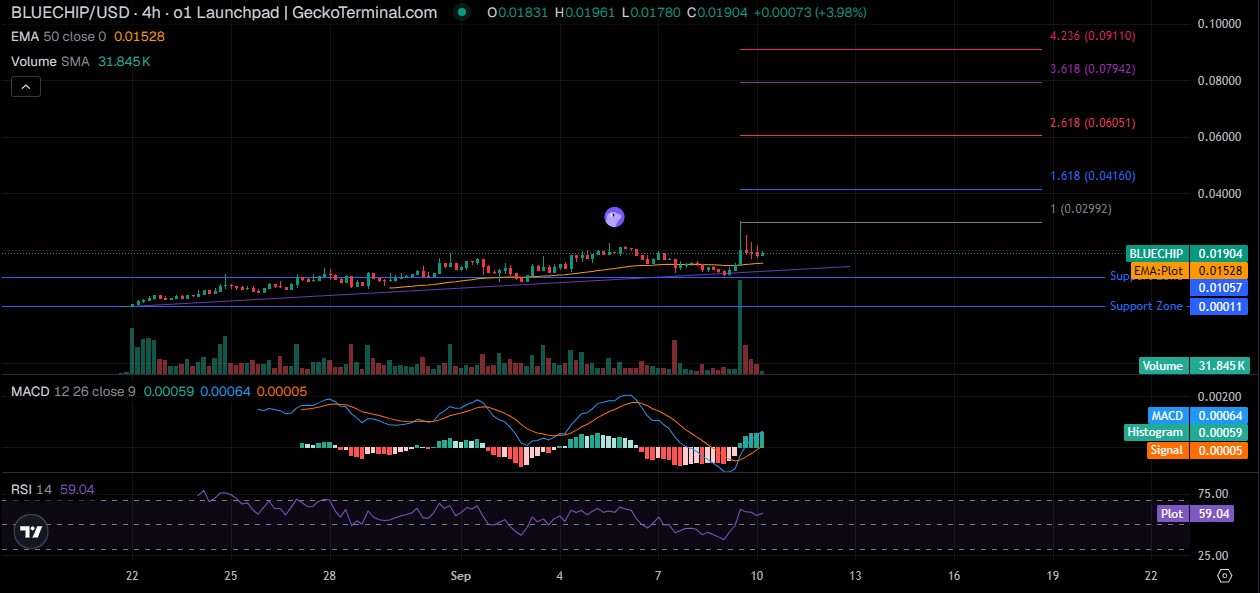
The first support sits right at the 50 EMA, currently near $0.01528. Below that, a wider support zone runs down toward $0.01057 and then $0.00011, based on the plotted zone on the BLUECHIP/USD live chart.
BLUECHIP Resistance Levels
Resistance starts at the recent high of $0.01961. Above it, the Fibonacci extensions stack up: $0.02992, $0.04160, $0.06051, $0.07942, and $0.09110.
Those upper levels are far off. But they mark where bulls would eventually want to test if trading keeps trending.
RSI and Momentum
Pulling up the RSI, the first thing that stood out was 59.04. Not overbought. Not oversold either. Just room to run, or room to fade.
Volume Confirmation
Volume spiked hard on the breakout candle, then dropped off. That's a classic pattern. It means the initial move had real buying behind it, but follow-through hasn't shown up yet.
Trend and Breakout Signals
The MACD line is above the signal line, and the histogram is positive. That's a bullish signal on paper. Turns out, though, momentum indicators lag price. Worth remembering.
Blue Chip Price Prediction 2026
Scenario | Target | Probability | Trigger | Invalidation |
Bull | $0.04160 | 25% | Clean breakout above $0.02992 with rising volume | Trading falls back under $0.01961 |
Base | $0.01961 | 45% | Range holds between EMA 50 and swing high | Break of $0.01528 |
Bear | $0.01057 | 30% | Support zone fails on falling volume | Recovery above $0.01700 |
Traders comparing multiple tokens can check the full price prediction hub for other forecasts alongside this one.
Blue Chip Price Prediction 2027-2030
Year | Bear | Base | Bull | Key Driver |
2027 | $0.006 | $0.025 | $0.050 | Holder growth and continued liquidity on the Base pool decide direction |
2028 | $0.008 | $0.035 | $0.075 | Wider adoption of tokenized-stock pairs on Base could lift volume |
2029 | $0.010 | $0.045 | $0.095 | Bitcoin cycle position likely sets the broader risk appetite |
2030 | $0.012 | $0.055 | $0.120 | Whether the NVDA-pairing narrative still holds weight by then |
Each figure here is tied to a reason, not a guess pulled from thin air. Market cap equals price times the 1 billion token supply, so every target below maps to a specific valuation.
Blue Chip Price Prediction 2027: Base target $0.025 implies a $25M market cap, about 30% above today's $19.45M level. Bear $0.006 mirrors a return toward the $0.011 all-time low under fading interest. Bull $0.050 needs a $50M cap, near 2.5x current, backed by sustained volume above $10M and fresh holder growth.
Blue Chip Price Prediction 2028: Base $0.035 puts market cap near $35M, assuming holder count roughly doubles from today's 7,155. Bear $0.008 reflects an $8M cap if liquidity thins and whales exit, similar to the current 95.70% whale concentration worsening. Bull $0.075 needs a $75M cap, tied to wider tokenized-stock adoption pulling in fresh Base volume.
Blue Chip Price Prediction 2029: Base $0.045 equals a $45M cap, roughly 2.3x today's valuation, assuming steady adoption without a major catalyst. Bear $0.010 marks a $10M cap if Bitcoin cycle weakness drags smaller Base tokens down with it. Bull $0.095 needs a $95M cap, close to 5x current, driven by a strong Bitcoin cycle lifting risk appetite broadly.
Blue Chip Price Prediction 2030: Base $0.055 implies a $55M cap, built on gradual holder and volume growth from current levels. Bear $0.012 marks a $12M cap if the NVDA-pairing narrative fades and BLUECHIP reverts to a plain meme token. Bull $0.120 needs a $120M cap, over 6x current, only realistic if the tokenized-equity narrative gains real traction on Base.
What Could Drive BLUECHIP Higher?
Liquidity growth on the base pool would tighten spreads and support bigger moves up. Market sentiment around meme coins broadly helps too when it's warm.
Bitcoin direction still sets the tone for smaller tokens like this one. Listings on bigger exchanges would add fresh demand overnight, and the exchange listing tracker is one way to watch for that.
Ecosystem development, especially around the tokenized-NVDA pairing narrative, gives BLUECHIP a story most meme coins don't have. Holder growth past the current 7.2K mark would be a healthy sign.
Rising volume, stable tokenomics with the full 1 billion supply already circulating, and fresh news catalysts round out the bull case. Broader coverage of this angle shows up in the AI and crypto news feed.
What Could Push BLUECHIP Lower?
A support breakdown below $0.01057 would be the clearest bearish signal. Liquidity deterioration on the pool makes every move more violent in both directions.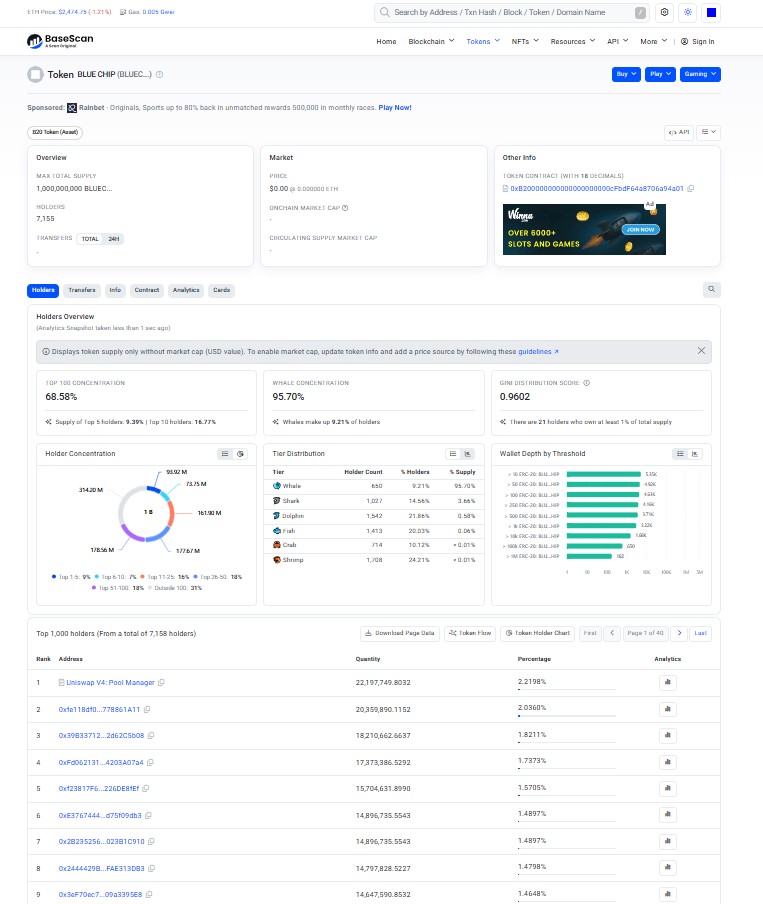
Whale selling is a real risk here. Onchain data on BaseScan's holder overview shows whale wallets control 95.70% of supply concentration, and the top ten holders alone hold 16.77%.
BTC weakness would drag this down with everything else. Low volume during any bounce should be treated as a warning sign, not confirmation.
There's no token unlock risk flagged currently, since supply is fully circulating. But negative project developments, or anything that dents confidence in the NVDA-pairing angle, could hit price fast.
Sentiment shifts like that usually show up first in memecoin crypto news before they hit the chart.
Can BLUECHIP Reach $0.01?
Let's do the math instead of guessing.
Required market cap = Target price × circulating supply. At $0.01 and one billion tokens circulating, that's a $10 million market cap.
The current market cap sits near $19.45 million. So $0.01 isn't a moonshot target. It's actually below where BLUECHIP is trading right now.
That flips the usual question. The real question isn't whether BLUECHIP can reach $0.01. It's whether it can avoid falling back to it if support breaks.
Under a shrinking-holder scenario, a $10 million valuation is entirely realistic. Under a growing one, the current price already sits above that mark.
Breaking: What the Latest Candle Shows
Price spiked. Volume followed. Then it faded fast.
RSI sits at 59. MACD stays positive. The picture is short-term bullish, not overheated yet.
Support at $0.01528 hasn't been tested since the breakout. That's the level to watch next.
Where This Leaves Traders
Support holds, and the base case plays out with a slow grind toward resistance. Support breaks, and $0.01057 comes back into play fast.
The base case looks more likely for now. Not because momentum guarantees anything. Because volume hasn't confirmed the breakout enough to trust the bull case yet.
Traders scanning for fresh reward opportunities alongside this one can check the crypto airdrops tracker as a final stop.
Disclaimer
This article is for informational purposes only and does not constitute financial advice. BLUECHIP is a highly volatile, low-cap token, and price predictions here are based on technical patterns and onchain data available as of the stated timestamp. Cryptocurrency markets carry significant risk, including total loss of capital. Independent research is strongly recommended before making any investment decision.
Also read:

















