Chainlink Price Forecast: CCIP Vault Adapters Meet a Key Test


A rough week for LINK holders just got a plot twist, and it shapes any Chainlink price forecast.
Fresh cross-chain plumbing landed from the oracle network, yet the market barely reacted, a sharp contrast with the story told in the earlier ETF inflows breakout coverage.
Buyers and sellers disagree. Only one camp can be right.
Chainlink Price Market Snapshot
LINK trades at $12.88 as of 09:40 UTC on October 9, 2026, down 2.17% in 24 hours. The 24-hour range ran from $12.13 to $13.17, and seven-day losses reach 10.43%.
Trading Volume and Supply
Volume jumped 53.04% to $486.53M, while price slipped, pointing to active selling. Circulating supply sits at 748.09M of a 1B maximum, per CoinMarketCap supply. And 251.91M tokens remain outside circulation.
Bitcoin and Ether Backdrop
Bitcoin trades at $82,537.24, down 0.68%, and Ethereum sits at $2,502.11, down 2.48%, so LINK price today isn't alone.
Altcoins tend to trade with the majors. And memecoin market news covers where risk fades fastest.
Why Is Chainlink Down Today?
Sellers hit LINK hard over the last 24 hours. Price slid from $13.17 to $12.13. Buyers stepped in at $12.13. The price recovered to $12.88. Wider market moves show up in the latest crypto news.
CCIP Vault Adapters News
The latest Chainlink news is CCIP Vault Adapters, a one-click cross-chain deposit tool running on Chainlink CCIP.
Vaults can accept deposits from more than 80 chains while strategy and accounting stay on one chain. Aave, Lombard, and Maple already adopted it.
Chainlink flagged the friction in a post on X. But headlines haven't lifted the price yet.
CCIP 2.0 Masterclass Date
LinkLab hosts a developer masterclass on CCIP 2.0 on October 22, 2026, at 16:00 UTC.
Events rarely move prices alone. More dates sit in the coin events calendar.
Futures and Open Interest
Open interest, the total value of open futures contracts, stands at $615.42M, while futures volume hit $660.02M against $124.08M in spot. That's over five times spot activity. CoinGlass derivatives data has the full breakdown.
Liquidations and Positioning
Liquidations, meaning forced exits from margin trades, totaled $4.61M in 24 hours, and longs paid about 97% of it.
The long/short ratio, comparing bullish and bearish accounts, reads 1.5569 on Binance and 2.58 on OKX. So who's holding all those longs? And a break of $12.11 would answer that fast.
Exchange Volume Split
Binance leads futures activity with $219.61M, followed by MEXC at $134.92M. Bybit posts $60.49M and OKX $59.88M. Exchange listing updates can shift that mix.
Spot ETF Flows
LINK ETF funds saw $0.00 in net inflow, meaning fresh money minus withdrawals, on October 8, 2026, a fifth flat session.
Total net assets stand at $211.70M, or 2.23% of market cap, across GLNK and CLNK, per SoSoValue ETF data. Flat flows sound bearish. Then again, maybe that's too harsh, since buyers added $2.62M on October 1.
Holder Count
Etherscan lists 914,085 LINK holder addresses. Wallet counts can hint at adoption, though price hasn't followed. Past wallet count news covered the same metric.
Whale Concentration
Whales, meaning 4,326 huge wallets, hold 90.83% of market cap.
The top 100 wallets control 60.77%, and only 12 holders own at least 1% each, per Etherscan token data. Whales are only 0.47% of holders. One heavy seller can bend the chart.
Whale Transaction Activity
Santiment tracked 681 whale transactions worth at least $100,000 on October 8, 2026.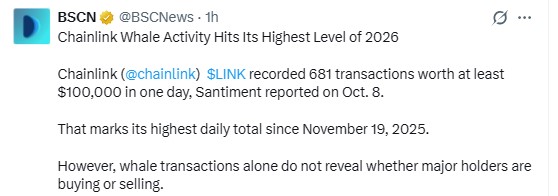
That's the highest daily total since November 19, 2025, and the busiest of 2026, per a BSCN post on X. But large transfers alone don't reveal whether holders are buying or selling.
Staking and Locked Supply
Binance 28 leads holders at 4.2203% of supply, and the Community Staking Pool holds 40,875,543 LINK.
Several non-circulating wallets hold 30M LINK each, and LINK staking news covers locked supply.
Technical Analysis: Descending Channel Setup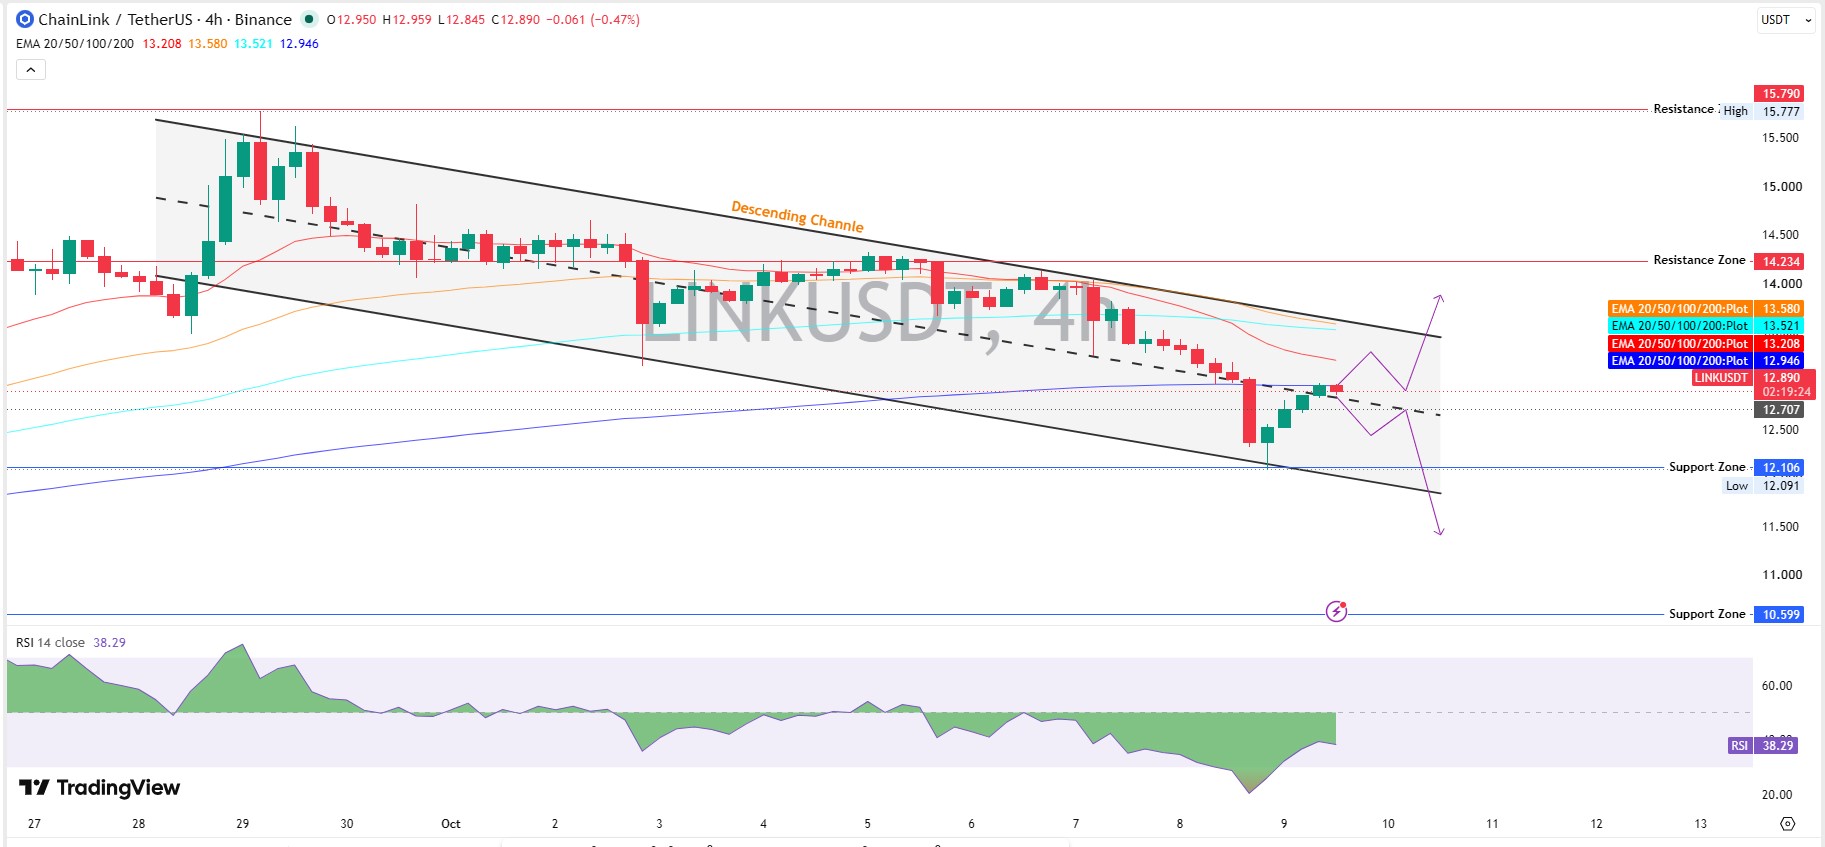
This Chainlink price forecast starts with a descending channel on the 4-hour chart.
Price hovers near the $12.71 midline after bouncing off the lower edge, per TradingView chart data. Lower highs since $15.78 remain intact. Structure favors sellers.
LINK technical analysis leans on EMA, short for exponential moving average, which weights recent trades more. The 20, 50, and 100 EMAs sit at $13.21, $13.58, and $13.52, all above price. Price is testing the 200 EMA at $12.95.
On the 4-hour chart, RSI reads 38.29 after sliding toward 20 earlier. Momentum is recovering. But it isn't bullish yet.
Support Levels
LINK support and resistance levels begin with $12.11 support, beside the $12.13 daily low. Below that, $10.60 is next. Everything hinges on one number. $12.11.
Resistance Levels
The first hurdle is the $13.21 to $13.58 EMA cluster, then the $14.23 resistance zone. But $14.23 sits roughly 10% above price. Beyond it, the $15.78 late September high marks the major ceiling.
Price Prediction Scenarios
Bull Case
Trades that reclaim the $13.58 EMA with rising volume could open $14.23 within two weeks. A Chainlink price target near $15.78 needs that first, and a slip under $13.21 voids it.
Base Case
Chop between $12.11 and $13.58 over seven days is the working price prediction if volume cools.
Bear Case
Trades below $12.11 would put $10.60 in play within two weeks. A reclaim of $13.21 would invalidate that setup.
Chainlink Price Forecast for October 2026
The Chainlink Price Forecast for October keeps a bearish short-term outlook, with $10.60 to $14.23 framing the month and $12.11 deciding direction.
Sellers keep the edge until $13.58 flips. And the October 2026 price prediction tracks that monthly view.
Key Risks
Risks cut both ways, so any price prediction stays conditional. Crowded longs and thin ETF flows could pressure price, while CCIP adoption could help. Headline rallies can fade fast. Earlier LINK Open USD news is worth a revisit.
Final Takeaway
This Chainlink price forecast keeps the price prediction cautious while LINK trades below $13.58. Bulls need two things. Volume, and a reclaim of that level.
More crypto price predictions await traders comparing setups.
Disclaimer: This article is for information only and isn't financial advice. Crypto prices are volatile, and every scenario here could fail.

















