Shiba Inu Price Prediction: Does a 1.95M SHIB Burn Move the Price?

Nearly 2 million SHIB were burned in the past day, yet that amount is worth only about $10.44. This Shiba Inu price prediction starts with that gap between a large-sounding number and its market value.
Shiba Inu launched in August 2020 as a dog-themed meme token on Ethereum.
The project later added Shibarium, its own layer-2 network, and the community tracks token burns through Shibburn. The Shiba Inu coin remains one of the largest meme assets by market value.
The Shiba Inu price today is $0.00000536, down 0.5% over the past 24 hours.
The token has traded between $0.00000510 and $0.00000545, and its market cap stands at $3.154 billion. That places it 37th by rank.
Anyone looking for a Shiba Inu price prediction 2026 outlook will see the price in the upper half of its daily range.
Market Data
Metric | Value |
Price | $0.00000536 |
24h Change | -0.5% |
24h Range | $0.00000510 to $0.00000545 |
Market Cap | $3.154 billion |
Source: market data taken from CoinGecko, as of Oct 9, 2026. Figures may vary slightly across other tracking websites.
Shiba Inu (SHIB) News Today
The latest Shiba Inu news comes from Shibburn, the community tracker for token burns. It reports that 1,945,871 SHIB were burned in the past 24 hours. The attached chart values that burn at $10.44.
By our arithmetic, the current price and market cap imply a supply near 588 trillion SHIB. The burn is therefore about 0.0000003% of supply. 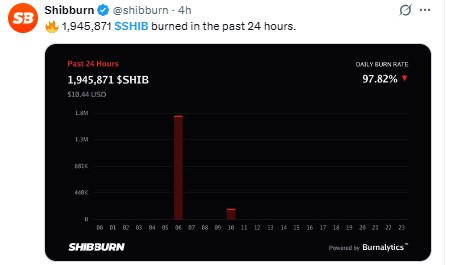
Source: Data Taken From the @shibburn X Account
At that size, it is unlikely to change the balance of supply and demand by itself.
The post also shows a daily burn rate of 97.82% with a downward arrow. It does not define that figure, so we draw no conclusion from it. We could not verify the numbers independently.
Technical Analysis
The daily chart shows SHIB above a rising trendline that began at the late July low. The line has held through several pullbacks since then.
The price fell from its late September high and has now stopped above the line.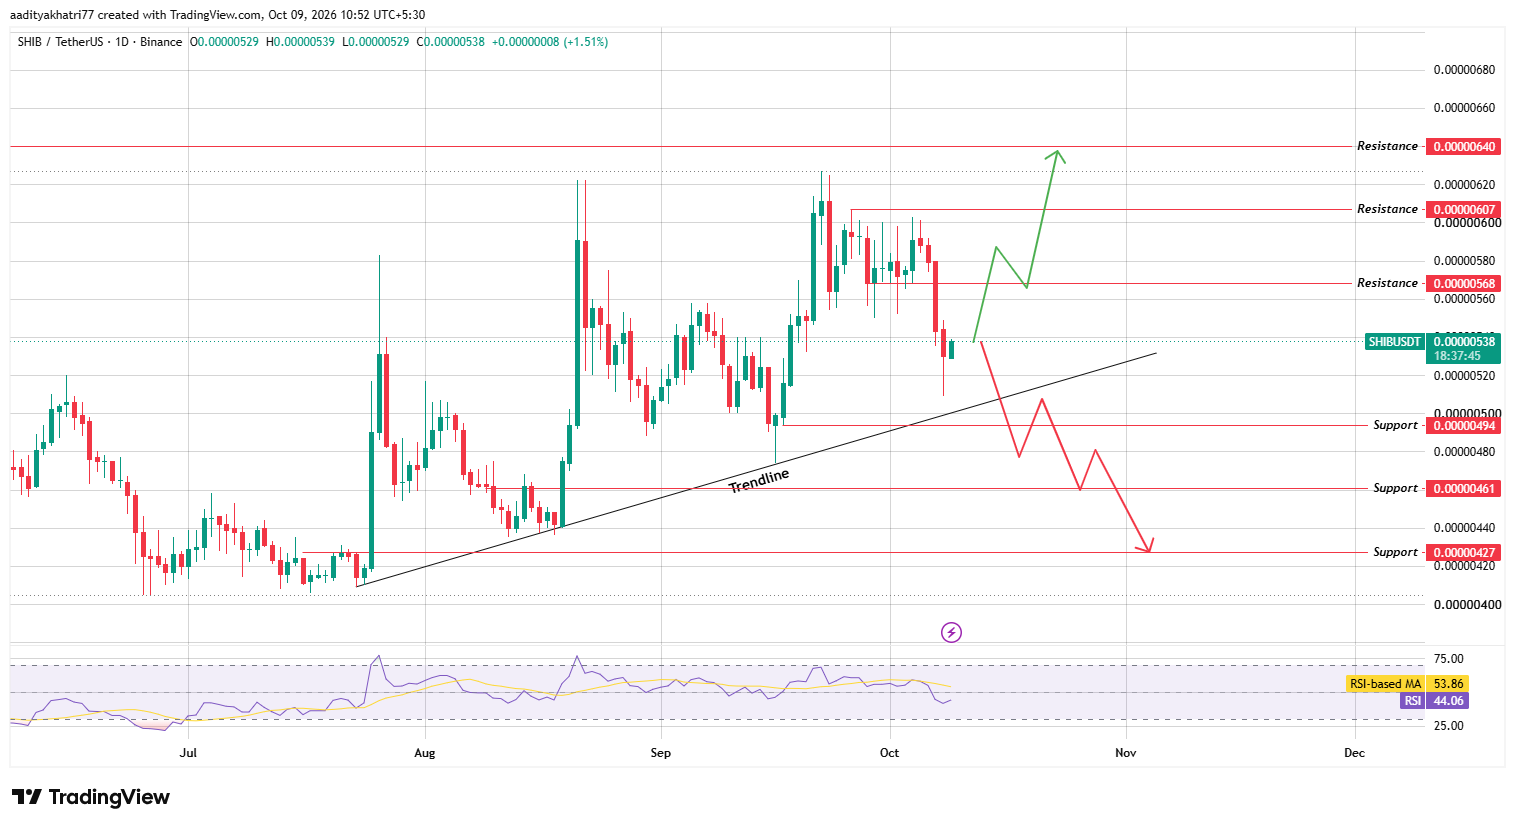
Source: TradingView, SHIB/USDT daily chart, Binance, October 9, 2026
SHIB trades near 0.00000538 on Binance after a sharp drop earlier this week. The current daily candle is up 1.51% and is due to close at 05:30 IST on October 10, which is 00:00 UTC. The reading can still change before then.
The RSI stands at 44.06, below its moving average of 53.86. Momentum is soft, but the reading is not oversold. Our Shiba Inu technical analysis therefore waits for price and volume to confirm the next move.
Shiba Inu Price Prediction: Can SHIB Bounce and Break Resistance?
The bullish case starts with the rising trendline holding as support. A bounce from there on volume above the 20-day average would show that buyers are defending the line.
The first test is resistance at 0.00000568, about 5.6% above the 0.00000538 chart price. A daily close above it, on rising volume, would be the first confirmation.
The next target is 0.00000607, roughly 12.8% higher, where the price stalled in late September.
A further advance would point to 0.00000640, about 19.0% above the chart price. A break above resistance on thin volume carries a high risk of failure, so volume matters at every step.
What Happens to SHIB If the Trendline Breaks?
The bearish case begins with a daily close below the rising trendline, together with sell volume above the 20-day average. That would end the series of higher lows that has formed since July.
The next step is a close below support at 0.00000494, about 8.2% under the chart price. The trendline sits just above that level, so a break would put it in play.
A confirmed break would open the way to 0.00000461, roughly 14.3% lower.
The final support on the chart is 0.00000427, a fall of about 20.6%, close to the July lows. The soft RSI adds to the caution, since it has not yet turned up.
Price Levels to Watch
These levels come from the daily chart and are judged on closing prices.
Support | Resistance |
0.00000494 | 0.00000568 |
0.00000461 | 0.00000607 |
0.00000427 | 0.00000640 |
Bull, Base, and Bear Scenarios
Scenario | Setup | Level |
Bull | Bounce from the trendline, then daily close above resistance on above-average volume | 0.00000607 to 0.00000640 |
Base | Price holds the trendline and moves between support and first resistance. | 0.00000494 to 0.00000568 |
Bear | Daily close below the trendline, then below support, on rising volume | 0.00000461 to 0.00000427 |
Shiba Inu vs Bitcoin
SHIB fell 0.5% against the dollar and was flat against Bitcoin over 24 hours. Simple arithmetic shows that Bitcoin lost roughly 0.5% in dollar terms. SHIB therefore moved in step with the largest crypto asset.
The Ethereum pair rose 2.7%, so SHIB held up better than Ethereum on the day. A steady Bitcoin would help SHIB defend the rising trendline.
A sharp Bitcoin decline would likely pull it toward 0.00000494.
Methodology
This Shiba Inu price prediction uses three inputs. The levels, the rising trendline, and the RSI come from the daily Binance SHIB/USDT chart on TradingView, captured at 10:52 IST on October 9, 2026.
Market data comes from a CoinGecko snapshot. The news item comes from a Shibburn post.
The chart price of 0.00000538 differs slightly from the CoinGecko price of 0.000005364. The two sources use different exchange data and time windows.
The chart candle is up 1.51% since 00:00 UTC, while CoinGecko shows a rolling 24-hour fall of 0.5%. We use the chart price for percentage distances.
We accept a breakout or breakdown only on a closed daily candle, with volume above the 20-day average.
That average is our own confirmation standard and does not come from the chart. No liquidation or exchange volume data was available, so neither is used.
Expert Opinion
General market commentary on rising trendlines holds that each hold shows a higher low, while a close below the line cancels that pattern.
A trendline that has held for months carries more weight than one drawn over a few days.
Applied to $SHIB, that view favors patience. A bounce followed by a daily close above 0.00000568 would favor buyers.
A close below the trendline and 0.00000494 would favor sellers. Burn reports can lift sentiment, yet at this scale price tends to follow demand.
Disclaimer: This article is for information only and is not financial advice. SHIB is a volatile meme token, and its price can fall below every support level listed here. A loss of the full amount invested is possible. Technical levels can fail, and no scenario above has a guaranteed probability. Please research independently and invest only what you can afford to lose.












.webp)




