Shiba Inu Price Prediction: First Golden Cross in 2 Years, Now What?


A rare bullish headline and a falling price do not often arrive on the same day. That contrast is where this Shiba Inu price prediction begins.
U.Today reports a notable milestone for the token, yet the market has pushed it 2.2% lower over the past 24 hours.
Shiba Inu launched in August 2020 as a dog-themed meme token on Ethereum.
The project later added Shibarium, its own layer-2 network, and the community followed token burns through Shibburn.
Today the Shiba Inu coin remains one of the largest meme assets by market value.
The shiba inu price today is $0.00000543, a decline of 2.2% over 24 hours.
The token has traded between $0.00000535 and $0.00000557 during the day, and its market cap stands at $3.2 billion.
Social media tags the token as $SHIB, while exchanges list it as $SHIB.
Readers looking for a Shiba Inu price prediction October 2026 outlook will find the price in the lower half of that daily range.
Shiba Inu (SHIB) Live Market Data
Metric | Value |
Price | $0.00000543 |
24h Change | -2.2% |
24h Range | $0.000005357 to $0.000005572 |
Market Cap | $3.2 billion |
Market Cap Rank | #37 |
Source: market data taken from CoinGecko, as of Oct 8, 2026. Figures may vary slightly across other tracking websites.
Shiba Inu (SHIB) News Today
The latest Shiba Inu news today comes from U.Today, it reports that SHIB has triggered its first Golden Cross in two years.
A Golden Cross forms when a shorter moving average rises above a longer one. Traders often read it as a sign of stronger momentum.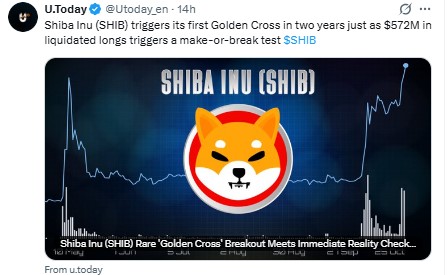
Source: Data Taken From @Utoday_en on X, October 8, 2026.
The same post links the signal to $572 million in liquidated long positions and calls the moment a make-or-break test.
Our 4H chart does not display moving averages, so we cannot confirm the crossover on our own.
Readers should treat it as a reported development and judge it against the price levels below.
Other Shiba Inu news, such as Shibburn burn reports or Shibarium updates, can also shift sentiment. Neither is part of today's report.
Shiba Inu (SHIB) Technical Analysis
The 4H chart shows SHIB moving inside a descending channel since the late September high near 0.00000627.
The price now sits close to the lower boundary, just above the 0.00000535 support level. The current 4H candle is due to close at 09:30 IST, so the reading can still change.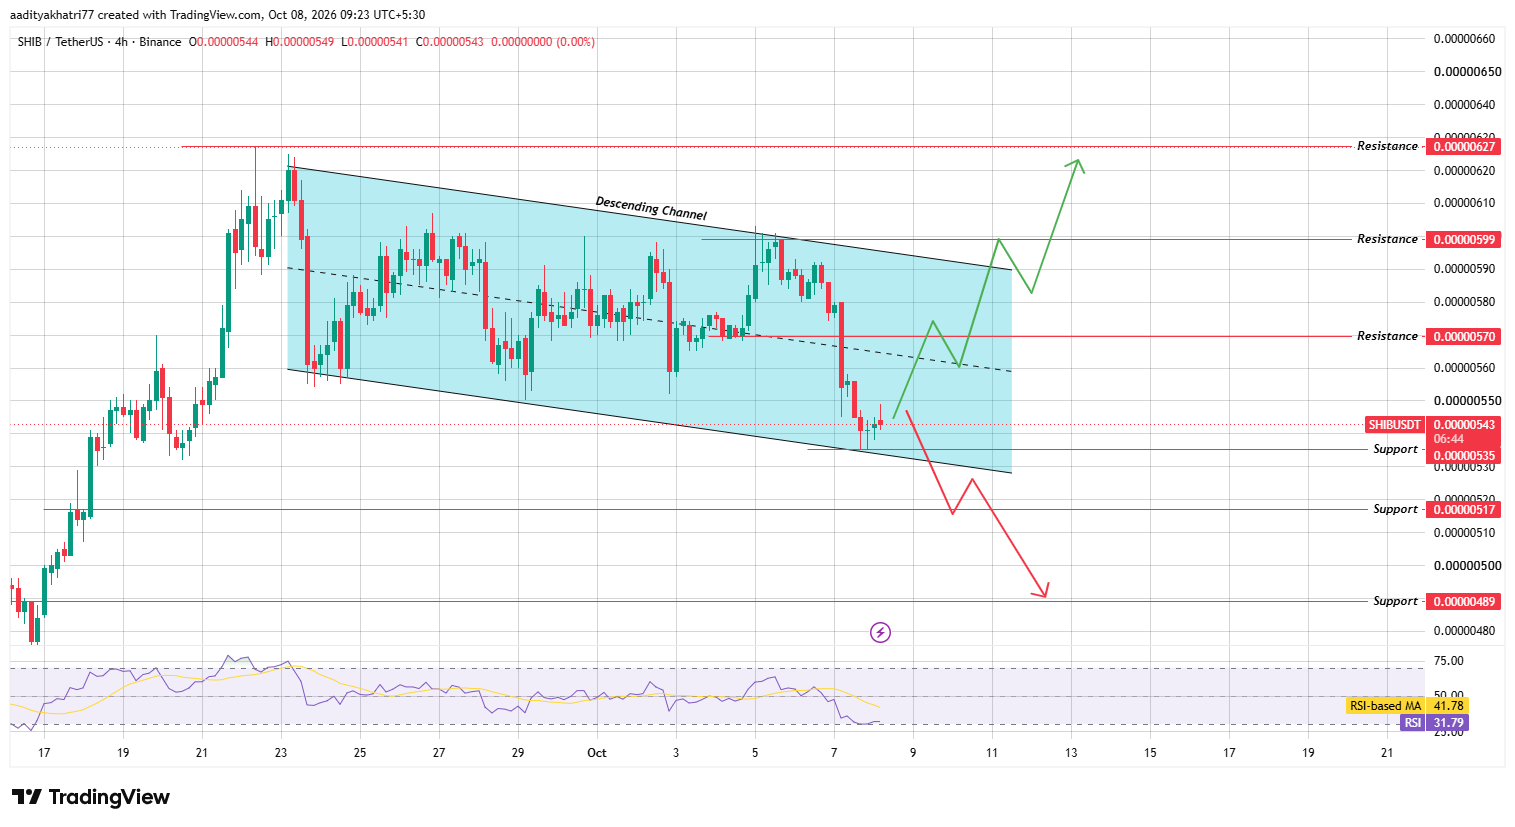
Source: TradingView, SHIB/USDT 4H chart, Binance, October 8, 2026
The RSI reads 31.79, below its moving average of 41.78. That combination points to weak momentum and a reading close to oversold territory. Oversold readings can precede a bounce, but they do not guarantee one.
Shiba Inu Price Prediction: Can SHIB Rebound From Support?
The bullish case starts with a bounce from the 0.00000535 support zone near the lower channel boundary.
A bounce would first meet resistance at 0.00000570, about 5.0% above the current price and close to the channel midline. A close above that level would show that buyers are regaining control.
The next test is the upper boundary of the channel near 0.00000599, roughly 10.3% higher. This breakout needs confirmation.
A 4H candle should close above the boundary, and volume should exceed the average of the previous 20 candles. Without that volume, a brief move above the line carries a high risk of failure.
If both conditions hold, the chart points toward 0.00000627, about 15.5% above the current price. That is where the late September high formed.
A move there would also make the Shiba Inu price prediction 2026 discussion more constructive.
What Happens to SHIB If Support Breaks?
The bearish case begins if the bounce fails and the price slips under 0.00000535. That level is only about 1.5% below the current price.
A 4H close below it, together with rising sell volume, would put the lower channel boundary at risk.
A confirmed break of that boundary opens the path to 0.00000517, roughly 4.8% lower. Below that, the next support sits at 0.00000489, a decline of about 9.9% from today's price.
The weak RSI adds to the caution, since momentum has not yet turned. A rise of the RSI back above its moving average of 41.78 would be the first sign that sellers are losing strength.
Price Levels to Watch
These shiba inu price levels come from the 4H chart and are judged on closing prices.
Support | Resistance |
0.00000535 | 0.00000570 |
0.00000517 | 0.00000599 |
0.00000489 | 0.00000627 |
Bull, Base, and Bear Scenarios
Scenario | Setup | Level |
Bull | 4H close above the channel upper boundary on above-average volume | 0.00000599 to 0.00000627 |
Base | Price moves between support and the channel midline. | 0.00000535 to 0.00000570 |
Bear | 4H close below the lower boundary on rising sell volume | 0.00000517 to 0.00000489 |
SHIB vs Bitcoin
SHIB fell 2.2% against the dollar but only 0.7% against Bitcoin over 24 hours.
Simple arithmetic shows that Bitcoin lost about 1.5% in dollar terms during the same period. The Ethereum pair tells a similar story, with a 0.6% decline.
In other words, the broader market slipped as well, and $SHIB fell a little faster than both majors.
A recovery in Bitcoin would therefore help any bounce in this chart. A deeper Bitcoin decline would add pressure to the 0.00000535 support.
Methodology
This Shiba Inu price prediction draws on three inputs. The price levels, the descending channel, and the RSI come from the 4H Binance SHIB/USDT chart on TradingView, captured at 09:23 IST on October 8, 2026.
Market data comes from a CoinGecko snapshot taken at the same time. The news item comes from a U.Today report.
We accept a breakout or breakdown only on a closed 4H candle, never on a move inside the candle. Volume should also exceed the 20-candle average.
Every target in this Shiba Inu price forecast sits at a level the chart has already tested. No liquidation or exchange volume data was available for this update, so neither is used.
Expert Opinion
General market commentary on moving average crossovers holds that the signal lags price. A Golden Cross confirms a trend that has already begun, so it works best when volume and closing prices agree.
Applied to SHIB, that view favors patience until the upper channel boundary at 0.00000599 gives way on a closed candle.
Ecosystem items such as Shibburn burn reports and Shibarium activity may influence sentiment, but they do not replace price confirmation.
Disclaimer: This article is for information only and is not financial advice. SHIB is a volatile meme token, and its price can fall below every support level listed here. A loss of the full amount invested is possible. Technical levels can fail, and no scenario above has a guaranteed probability. Please research independently and invest only what you can afford to lose.












.webp)




