Shiba Inu Price Prediction: Here's What Happened in the Past 30 Days?

Shiba Inu has had a rough month. SHIB trades at $0.000003859, below its key EMAs, after leaving an ascending channel in October.
This Shiba Inu Price Prediction lists what happened in the past 30 days and checks it against the daily chart. A daily close above $0.000004000 would be the first sign of recovery.
Market data checked on November 19, 2026, at 16:22 IST.
Shiba Inu Price Prediction Today: Market Overview
Metric | Value |
Price (TradingView OKX daily chart) | $0.000003859 |
Daily Candle Change | +1.39% |
SHIB Liquidation Data: Small Amounts, Mostly Longs
A liquidation is a forced close of a leveraged trade when the trader can no longer cover losses. Longs bet on a rise, and shorts bet on a fall.
Window | Total Liquidated | Long | Short |
12h | $43.58 | $6.72 | $36.86 |
24h | $44.94K | $43.77K | $1.17K |
Source: Data From CoinGlass
Longs took about 97% of the 24-hour total. The 12-hour total is only $43.58, so the longs were hit in the earlier half of the day.
Shiba Inu News Today: Here's What Happened in the Past 30 Days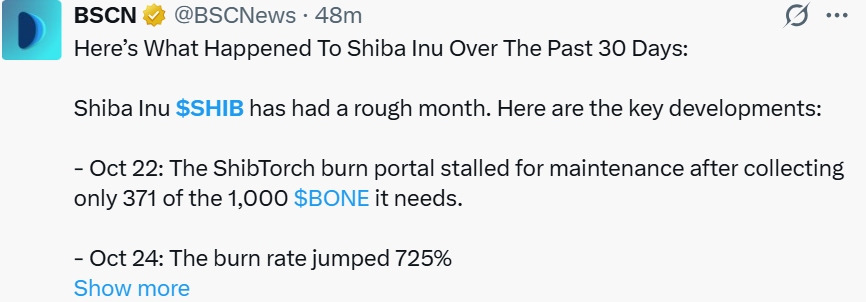
BSCN posted on X a 30-day recap about 34 minutes before publication. CoinGabbar could not verify each item.
Date | Reported event |
Oct 22 | ShibTorch portal paused, 371 of 1,000 BONE collected |
Oct 24 | Burn rate up 725% after a 20.41M SHIB transfer |
Nov 8 | Large holders pulled a net 20B $SHIB off exchanges |
Nov 10 | Shibarium recorded just 691 transactions in one day |
Nov 10 | 137 fake tokens use Ryoshi's name |
Nov 17 | 312B $SHIB left exchanges, and holders passed 1.7M |
Nov 18 | Whales moved over 6B $SHIB back to exchanges |
The burn rate is how fast $SHIB is sent to dead wallets. Coins leaving exchanges do not by themselves show buying. Read our SHIB burn explained guide.
Shiba Inu Price Prediction Watch: The Kusama Teaser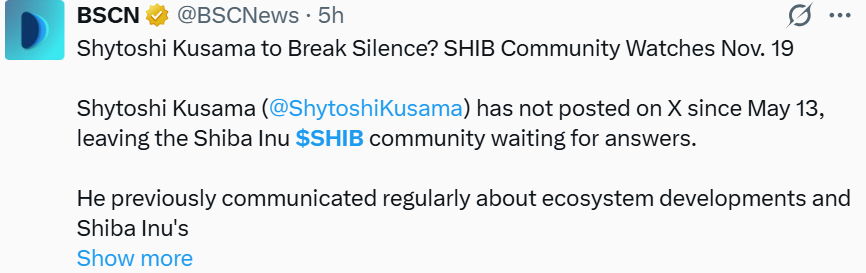
The BSCN posted about 5 hours before publication that Shytoshi Kusama has not posted on X since May 13.
It adds that Kusama has not confirmed leaving, and that his silence does not show he stopped contributing.
A community member, Mazrael, posted "Here goes something" with an eyes emoji, pointing to November 19 at 11 a.m. UTC (16:30 IST). It gives no details and is not confirmed to involve Kusama.
Source: Data From X
Shiba Inu Price Prediction: Technical Analysis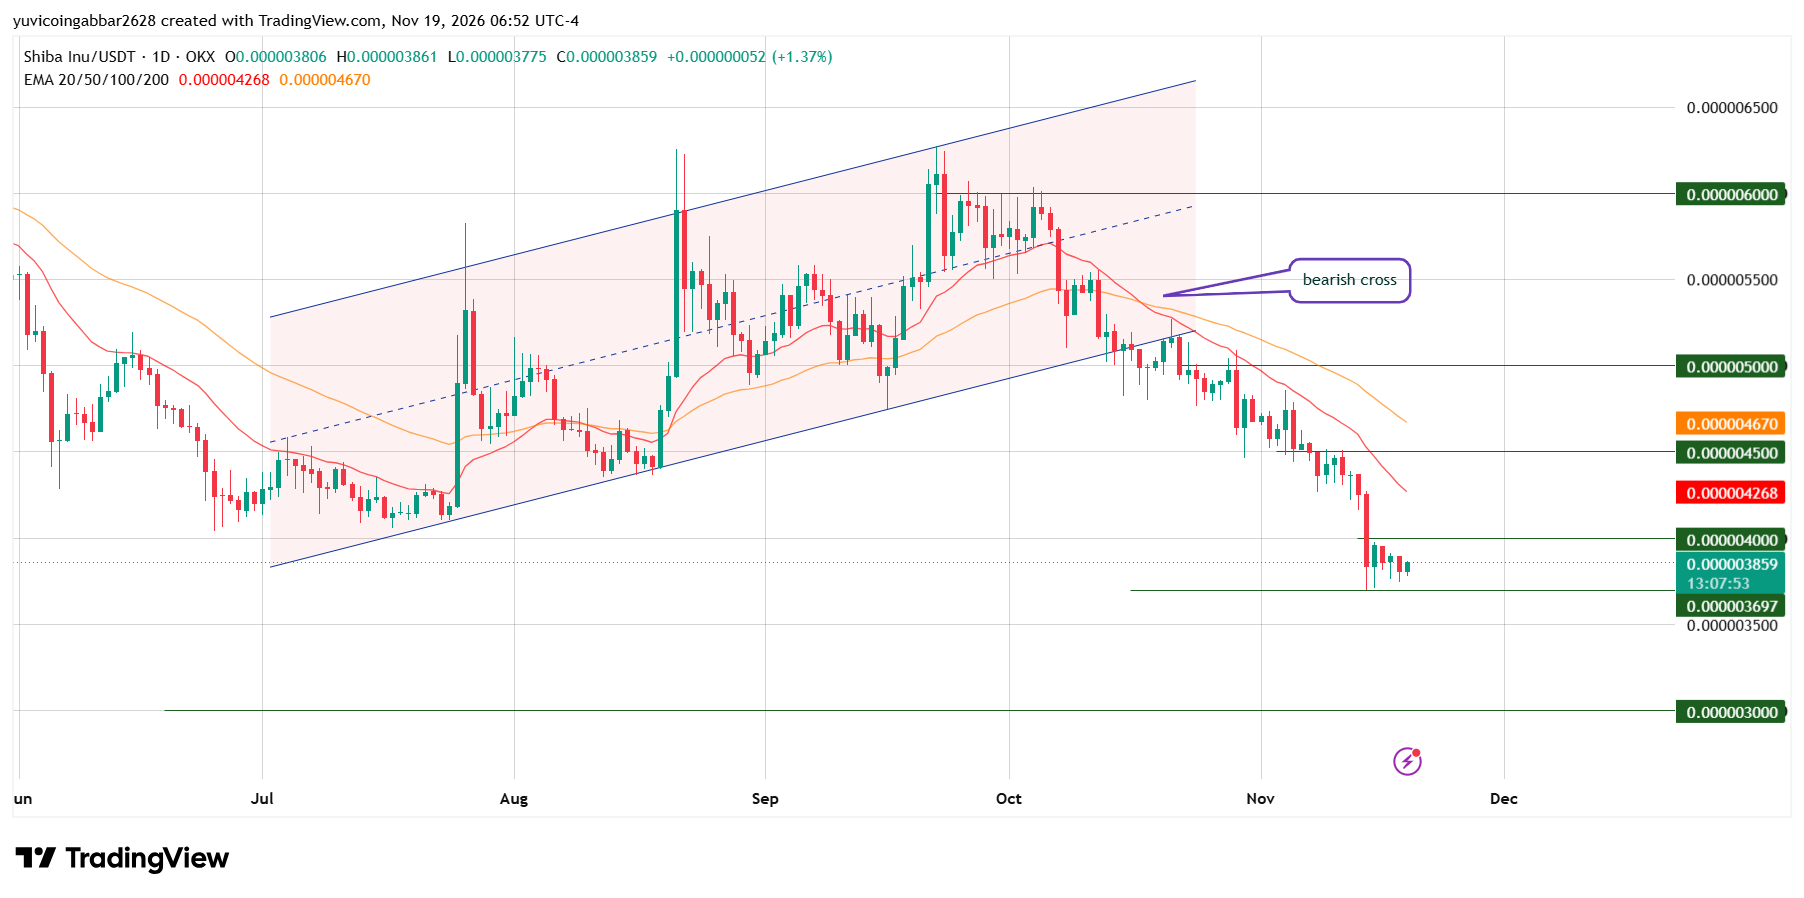
SHIB rose inside an ascending channel from July and peaked near $0.000006300 in late September. A channel is a pair of sloping lines that contain price.
$SHIB lost the lower line in October, and the chart marks a "bearish cross," where a short 20 EMA $0.000004268 falls under a 50 EMA $0.000004670.
EMA, or exponential moving average, averages recent closes and weights newer days more. The price fell to a low near $0.000003697 around November 14.
Shiba Inu Price Prediction: $SHIB Support and Resistance Levels
Type | Level |
Highest marked level | $0.000006000 |
Upper resistance | $0.000005000 |
Resistance zone | $0.000004500 |
Initial recovery level | $0.000004000 |
Immediate price reference | $0.000003859 |
First confirmed support | $0.000003697 |
Deeper support | $0.000003000 |
Shiba Inu Price Prediction Scenarios (November 19, 2026)
Bull scenario: For this Shiba Inu crypto prediction, a daily close above $0.000004000 would point to a move toward $0.000004500. The setup fails if $SHIB closes back below $0.000004000.
Base scenario: If $SHIB stays between $0.000003697 and $0.000004000, the price would likely move sideways.
Bear scenario: A daily close below $0.000003697 would open a slide toward $0.000003000. The setup fails if $SHIB closes back above $0.000003697.
Shiba Inu Price Prediction: Will $SHIB Recover to $0.000006000?
The highest marked level, $0.000006000, is about 56% above $0.000003859. Any Shiba Inu price forecast toward it needs $SHIB to clear $0.000004000, both EMAs and $0.000005000 first. See our $SHIB price history.
Shiba Inu Price Prediction: CoinGabbar Technical Read
The trend is down, and the news has not changed it. Only a close above $0.000004000 would show a recovery. See our latest crypto price predictions.
Disclaimer
This article is for informational purposes only and isn't financial advice. Crypto markets are volatile. Always do your own research before making any trading decisions involving SHIB.
















