Shiba Inu Price Prediction: SHIB Death Cross Hits After Over a Year?


Is the SHIB death cross a warning? Shiba Inu just flashed its first bearish death cross in over a year as price slid under $0.000004.
In this Shiba Inu Price Prediction, SHIB trades at $0.000003836 and sellers still lead. A close above $0.000004000 would be the first sign of a bounce.
Market data checked on November 17, 2026, at 15:28 IST.
Shiba Inu Price Prediction Today: Market Overview
Metric | Value |
Price (TradingView OKX daily chart) | $0.000003836 |
Daily Candle Change | -1% |
Candle Open | $0.000003862 |
Candle Range | $0.000003814 – $0.000003896 |
SHIB Liquidation Data: Longs Take 97%
A liquidation is a forced close of a leveraged trade when the trader can no longer cover losses. Longs bet on a rise, and shorts bet on a fall. Coinglass shows:
Window | Total Liquidated | Long | Short |
1h | $20.14K | $20.14K | $0.00 |
4h | $20.14K | $20.14K | $0.00 |
12h | $20.25K | $20.25K | $0.01 |
24h | $34.88K | $33.76K | $1.12K |
Longs took about 97% of the $34.88K liquidated over 24 hours. About 58% of that total came in the last hour, and all of it was longs, which fits a fresh drop.
Shiba Inu News: Death Cross Flashes for the First Time in a Year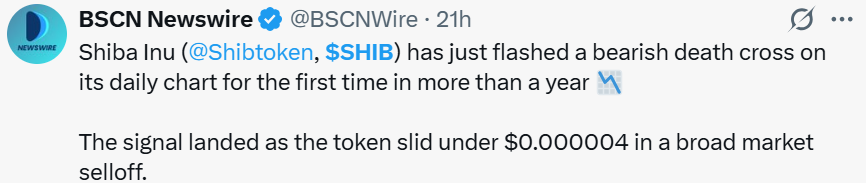
A post on X about 21 hours before publication: "Shiba Inu (@Shibtoken, $SHIB) has just flashed a bearish death cross on its daily chart for the first time in more than a year.
The signal landed as the token slid under $0.000004 in a broad market selloff."
A death cross is when a shorter-term average price falls below a longer-term one. Many traders read it as a sign of a weak trend. It lags price and is not a forecast.
Shiba Inu Price Prediction 2026: Technical Analysis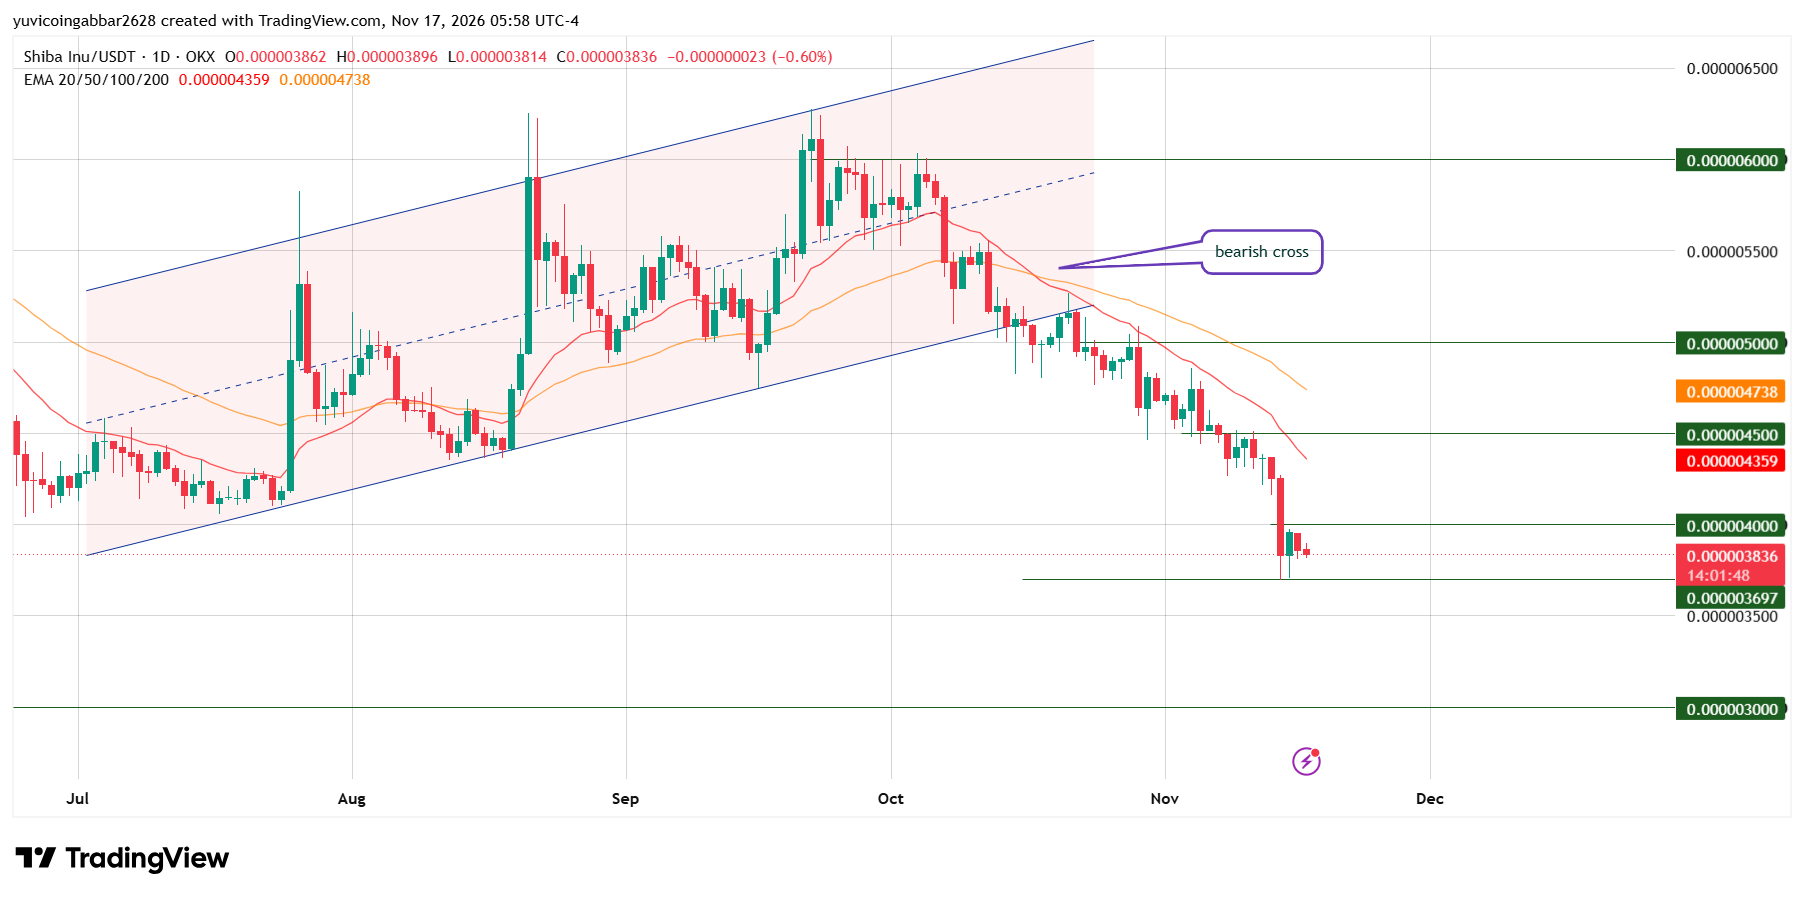
SHIB peaked near $0.000006000 in September. It had climbed inside a rising channel, a pair of upward-sloping boundaries that hold price in a range, but it fell below the lower boundary in early October.
A long red candle on November 14 reached the $0.000003697 level, and buyers stepped in. Today's candle opened at $0.000003862, dipped to $0.000003814 and printed $0.000003836, a small red candle that is still open.
EMA, or exponential moving average, averages recent closes and weights newer days more. The chart labels a bearish cross in October, with EMA 20 at $0.000004359 under EMA 50 at $0.000004738, and the price sits below both.
The post's death cross may use a longer pair that our chart does not show.
Shiba Inu Forecast: SHIB Support and Resistance Levels
Type | Level |
Highest marked level | $0.000006000 |
Resistance zone | $0.000005000 |
Resistance zone | $0.000004500 |
Initial recovery level | $0.000004000 |
Immediate price reference | $0.000003836 |
First confirmed support | $0.000003697 |
Deeper support | $0.000003000 |
Shiba Inu Price Prediction Scenarios (November 17, 2026)
Bull scenario: For this Shiba Inu prediction, a daily close above $0.000004000 would point to a move toward $0.000004500. The setup fails if $SHIB closes back below $0.000004000.
Base scenario: If $SHIB stays between $0.000003697 and $0.000004000, the price would likely move sideways. A break of either level ends the range.
Bear scenario: A daily close below $0.000003697 would open a slide toward $0.000003000. The setup fails if $SHIB closes back above $0.000003697.
Shiba Inu Price Prediction: Can SHIB Reach $0.000006000?
It would take a gain of about 56% from $0.000003836. Any Shiba Inu price Forecast toward $0.000006000 needs $SHIB to clear $0.000004000, $0.000004500 and $0.000005000 first. See our $SHIB price history.
Shiba Inu Prediction: CoinGabbar Technical Read
The trend is down. Small liquidations suggest heavy leverage is not driving the fall.
Only a close above $0.000004000 would confirm a bounce, while a close below $0.000003697 would keep sellers in control. See our latest crypto price predictions.
Disclaimer
This article is for informational purposes only and isn't financial advice. Crypto markets are volatile. Always do your own research before making any trading decisions involving SHIB.