Shiba Inu Price Prediction: Can SHIB Survive the Hot CPI Shock?


Did one inflation report just crack the SHIB chart?
A 3.61% slide followed hotter September CPI data, and the rising channel broke.
This Shiba Inu price prediction starts with the Shiba Inu price today, $0.000004944, recorded on October 15, 2026 at 11:28 UTC. An earlier September Shiba Inu forecast assumed that channel would hold. It didn't.
Shiba Inu Price Today: Market Snapshot
These figures come from CoinMarketCap data as of 11:28 UTC.
Metric | Value |
Price | $0.000004944 |
24H change | -3.61% |
24H range | $0.000004875 to $0.000005166 |
Market cap | $2.91B |
24H volume | $84.56M (+42.24%) |
Volume jumped 42.24% while price slid. And that pairing says sellers meant it.
Supply and Liquidity
Circulating supply is 589.23T against a 589.55T max, so dilution isn't the worry. Meme sector rotation sits in meme coin news.
Why Is Shiba Inu Down Today?
CPI came in hot. Rate hike fears jumped. Risk assets sold off.
Bitcoin fell 2.86% to $80,937.71. Which dragged meme coins lower. SHIB lost its channel floor in the process. BTC sets the mood, which is why the Bitcoin price prediction matters for altcoins.
How September CPI Hit SHIB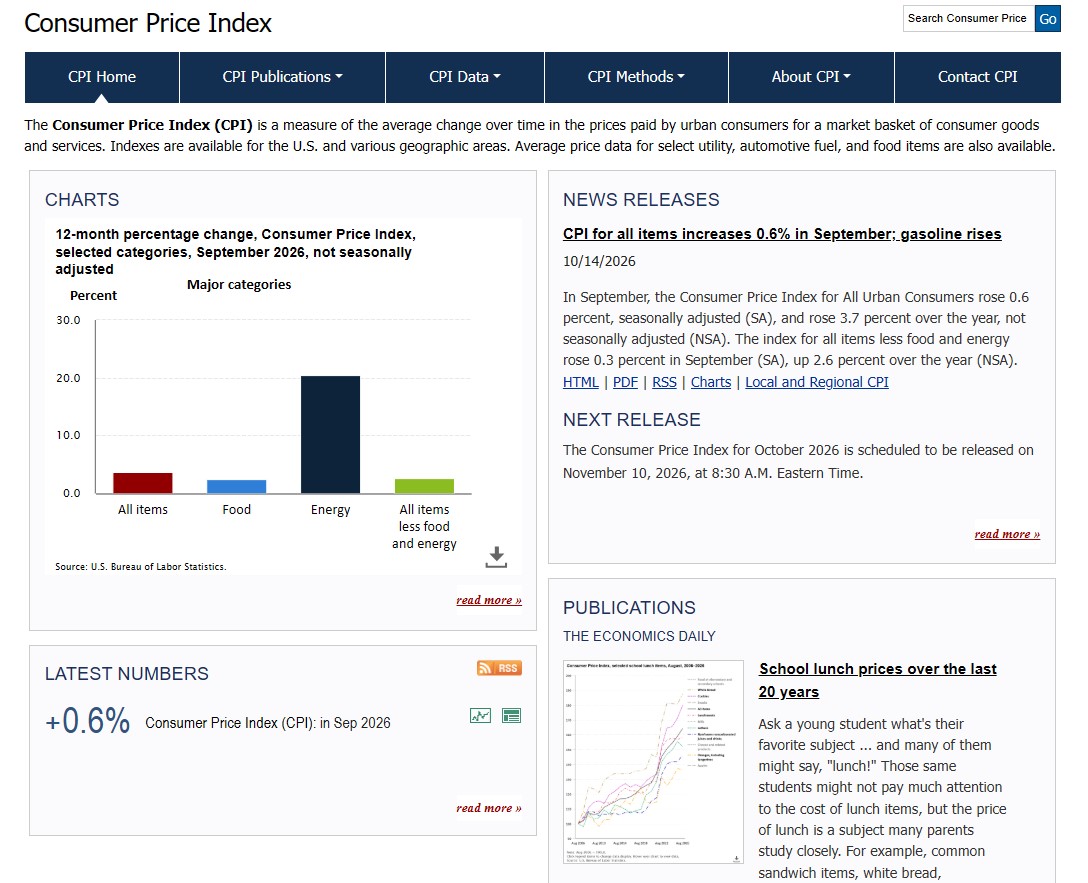
The report, released October 14, 2026, showed September CPI up 0.6% on the month and 3.7% on the year, according to the September CPI report.
Hotter prices raise the odds of another Fed rate hike. Speculative coins like SHIB tend to feel that first. The next release lands on November 10, 2026 at 13:30 UTC.
Shiba Inu Futures Data
Derivatives numbers from CoinGlass futures data show who got hurt.
Metric | Value |
Futures volume (24H) | $49.80M |
Long liquidations (24H) | $207.68K |
Short liquidations (24H) | $12.24K |
OKX long/short ratio | 2.83 |
Longs took the beating. And with open interest at $54.89M and OKX accounts still leaning long at 2.83, more flushing is possible.
Shiba Inu Performance by Timeframe
Period | Change |
7D | -8.85% |
30D | -5.46% |
90D | +20.39% |
Year to date | -28.25% |
The 90-day gain shows the bigger recovery hasn't vanished. But the 7-day slide says momentum has cracked.
Whale Concentration on Etherscan
Etherscan holder data shows 1,698,118 holders, yet ownership is extremely top-heavy.
Metric | Value |
Whale wallets | 775 |
Whale share of market cap | 94.64% |
Top 5 holders | 57.93% |
Gini score | 0.9958 |
A Gini score near 1 means supply sits in very few hands.
Burn Wallet Share
One null address holds 41.04% of all SHIB, worth about $2.03B. That's a burned supply, parked where nobody can spend it. It ties back to the burn rate spike covered on August 31.
Shiba Inu News Today
A Whale Insider post says an original team member is set to launch on Solana soon, paired with SHIB.
Nothing official confirms it. And a 3.61% drop says the market isn't treating it as a catalyst.
Japan Listing Sentiment Check
August's Nomura-backed listing in Japan, covered in the Japan listing story, gave sentiment a lift. Price now trades about 8% below the $0.000005376 recorded on August 24, 2026. But headlines fade fast.
Shiba Inu Price Prediction: Technical Analysis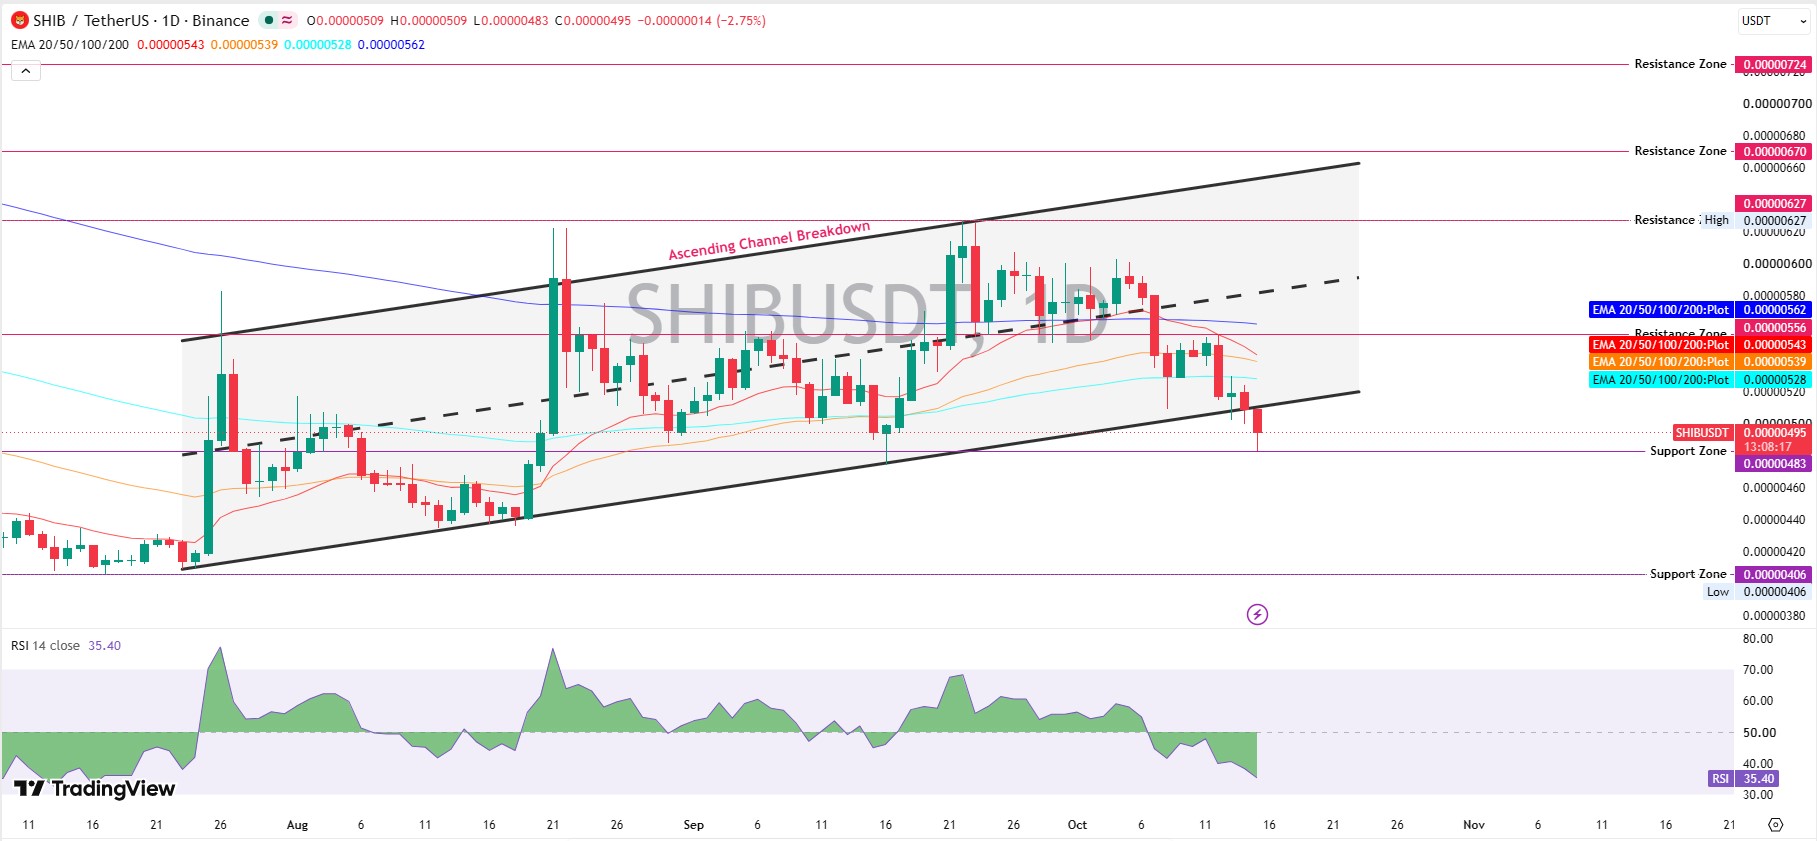
SHIB technical analysis on the TradingView daily chart shows an ascending channel breakdown on SHIB/USDT.
Trading below a channel floor that held since July flips old support into new resistance. That's the bearish read. Early September's falling wedge setup read neutral. This one doesn't.
RSI is at 35.40; there's still room to fall. So where does the selling stop? A bounce seems near. Actually, scratch that, RSI is still sliding, not turning.
An EMA is a moving average that weights recent trading more heavily. The 20 EMA, 50 EMA, 100 EMA, and 200 EMAs sit at $0.00000543, $0.00000539, $0.00000528, and $0.00000562. Price trades under all four. And each one now caps rallies.
Support Levels
Support is a floor where buyers stepped in before. Today's low of $0.00000483 comes first, then $0.00000475.
Below both sits $0.00000406, the chart's last major floor.
Resistance Levels
Resistance is a ceiling where sellers appeared before. $0.00000500 flipped from floor to ceiling today.
Next come $0.00000539 to $0.00000556, where the 20 and 50 EMAs overlap a resistance zone, then $0.00000627, $0.00000670, and $0.00000724.
Can Shiba Inu Go Up? Three Scenarios
Bull Case
Reclaiming $0.00000500 could open $0.00000539 to $0.00000556, but only with rising volume. Rejection there, or a drop below $0.00000483, cancels it.
Base Case
A chop between $0.00000483 and $0.00000500 is possible if CPI fear cools. A break of either edge ends it.
Bear Case
Losing $0.00000483 could send the price toward $0.00000475, then $0.00000406. Bias stays here near the term.
How Peers Performed
Over seven days, SHIB's 8.85% slide tracks Dogecoin's 8.2% drop, based on CoinMarketCap's similar coins panel. More context sits in the Dogecoin price prediction.
Long-Term SHIB Price Forecast
Price trades 94.42% below the $0.00008845 all-time high from October 28, 2021. Reclaiming the EMA stack comes first. But targets beyond that stay guesses in this Shiba Inu price prediction, though the Shiba Inu 2027 forecast offers a wider timeframe.
Risks That Could Change the Forecast
Another hot CPI print on November 10, 2026 could extend the drop, since this selloff started with inflation.
Whale selling, a fading Solana rumor, and capital rotating toward other sectors, including those tracked in AI crypto news, could weigh too.
Final Takeaway
Bias stays bearish while price trades below $0.00000500. The channel break, an RSI of 35.40, and four overhead EMAs all point the same way.
A cooler CPI reading, or a reclaim of $0.00000539, would change that. More coins sit in the crypto price predictions hub, though this Shiba Inu price prediction stays bearish for now.
Disclaimer: This article is for informational purposes only and isn't financial advice. Crypto markets are volatile, and prices can move sharply in either direction. Readers should research independently and consult a licensed advisor before making decisions.
















