Uniswap Price Prediction: Are UNI Longs Gaining as $7.00 Holds?

Are UNI longs gaining? The chart shows $UNI holding the $7.00 floor of a range. In this Uniswap Price Prediction, $UNI trades at $7.2170, inside a $7.0000 to $7.4996 band it has mostly held since early October.
A recent dip under $7.00 did not last. A close above $7.4996 would be the first sign of a breakout.
Market data checked on November 2, 2026, at 22:18 IST.
Uniswap Price Prediction Today: Market Overview
Metric | Value |
Price (TradingView daily chart) | $7.2170 |
Daily Candle Change | +0.50% |
Candle Open | $7.2075 |
Candle Range | $7.1238 – $7.3362 |
Uniswap News Today: Longs Narrow the Gap With Shorts
UNI has increased rapidly, narrowing the gap with short positions. A long is a leveraged bet on a rise, and a short is a bet on a fall.
The post says the market has reached a near-neutral state, meaning longs and shorts are close to balanced. It adds there are signs that short positions may begin to decline.
The post shows no figures, chart or data source, so CoinGabbar could not verify it. A balanced market means neither side is crowded. It does not show which way price will move.
Source: Data From X
Uniswap Price Prediction: Technical Analysis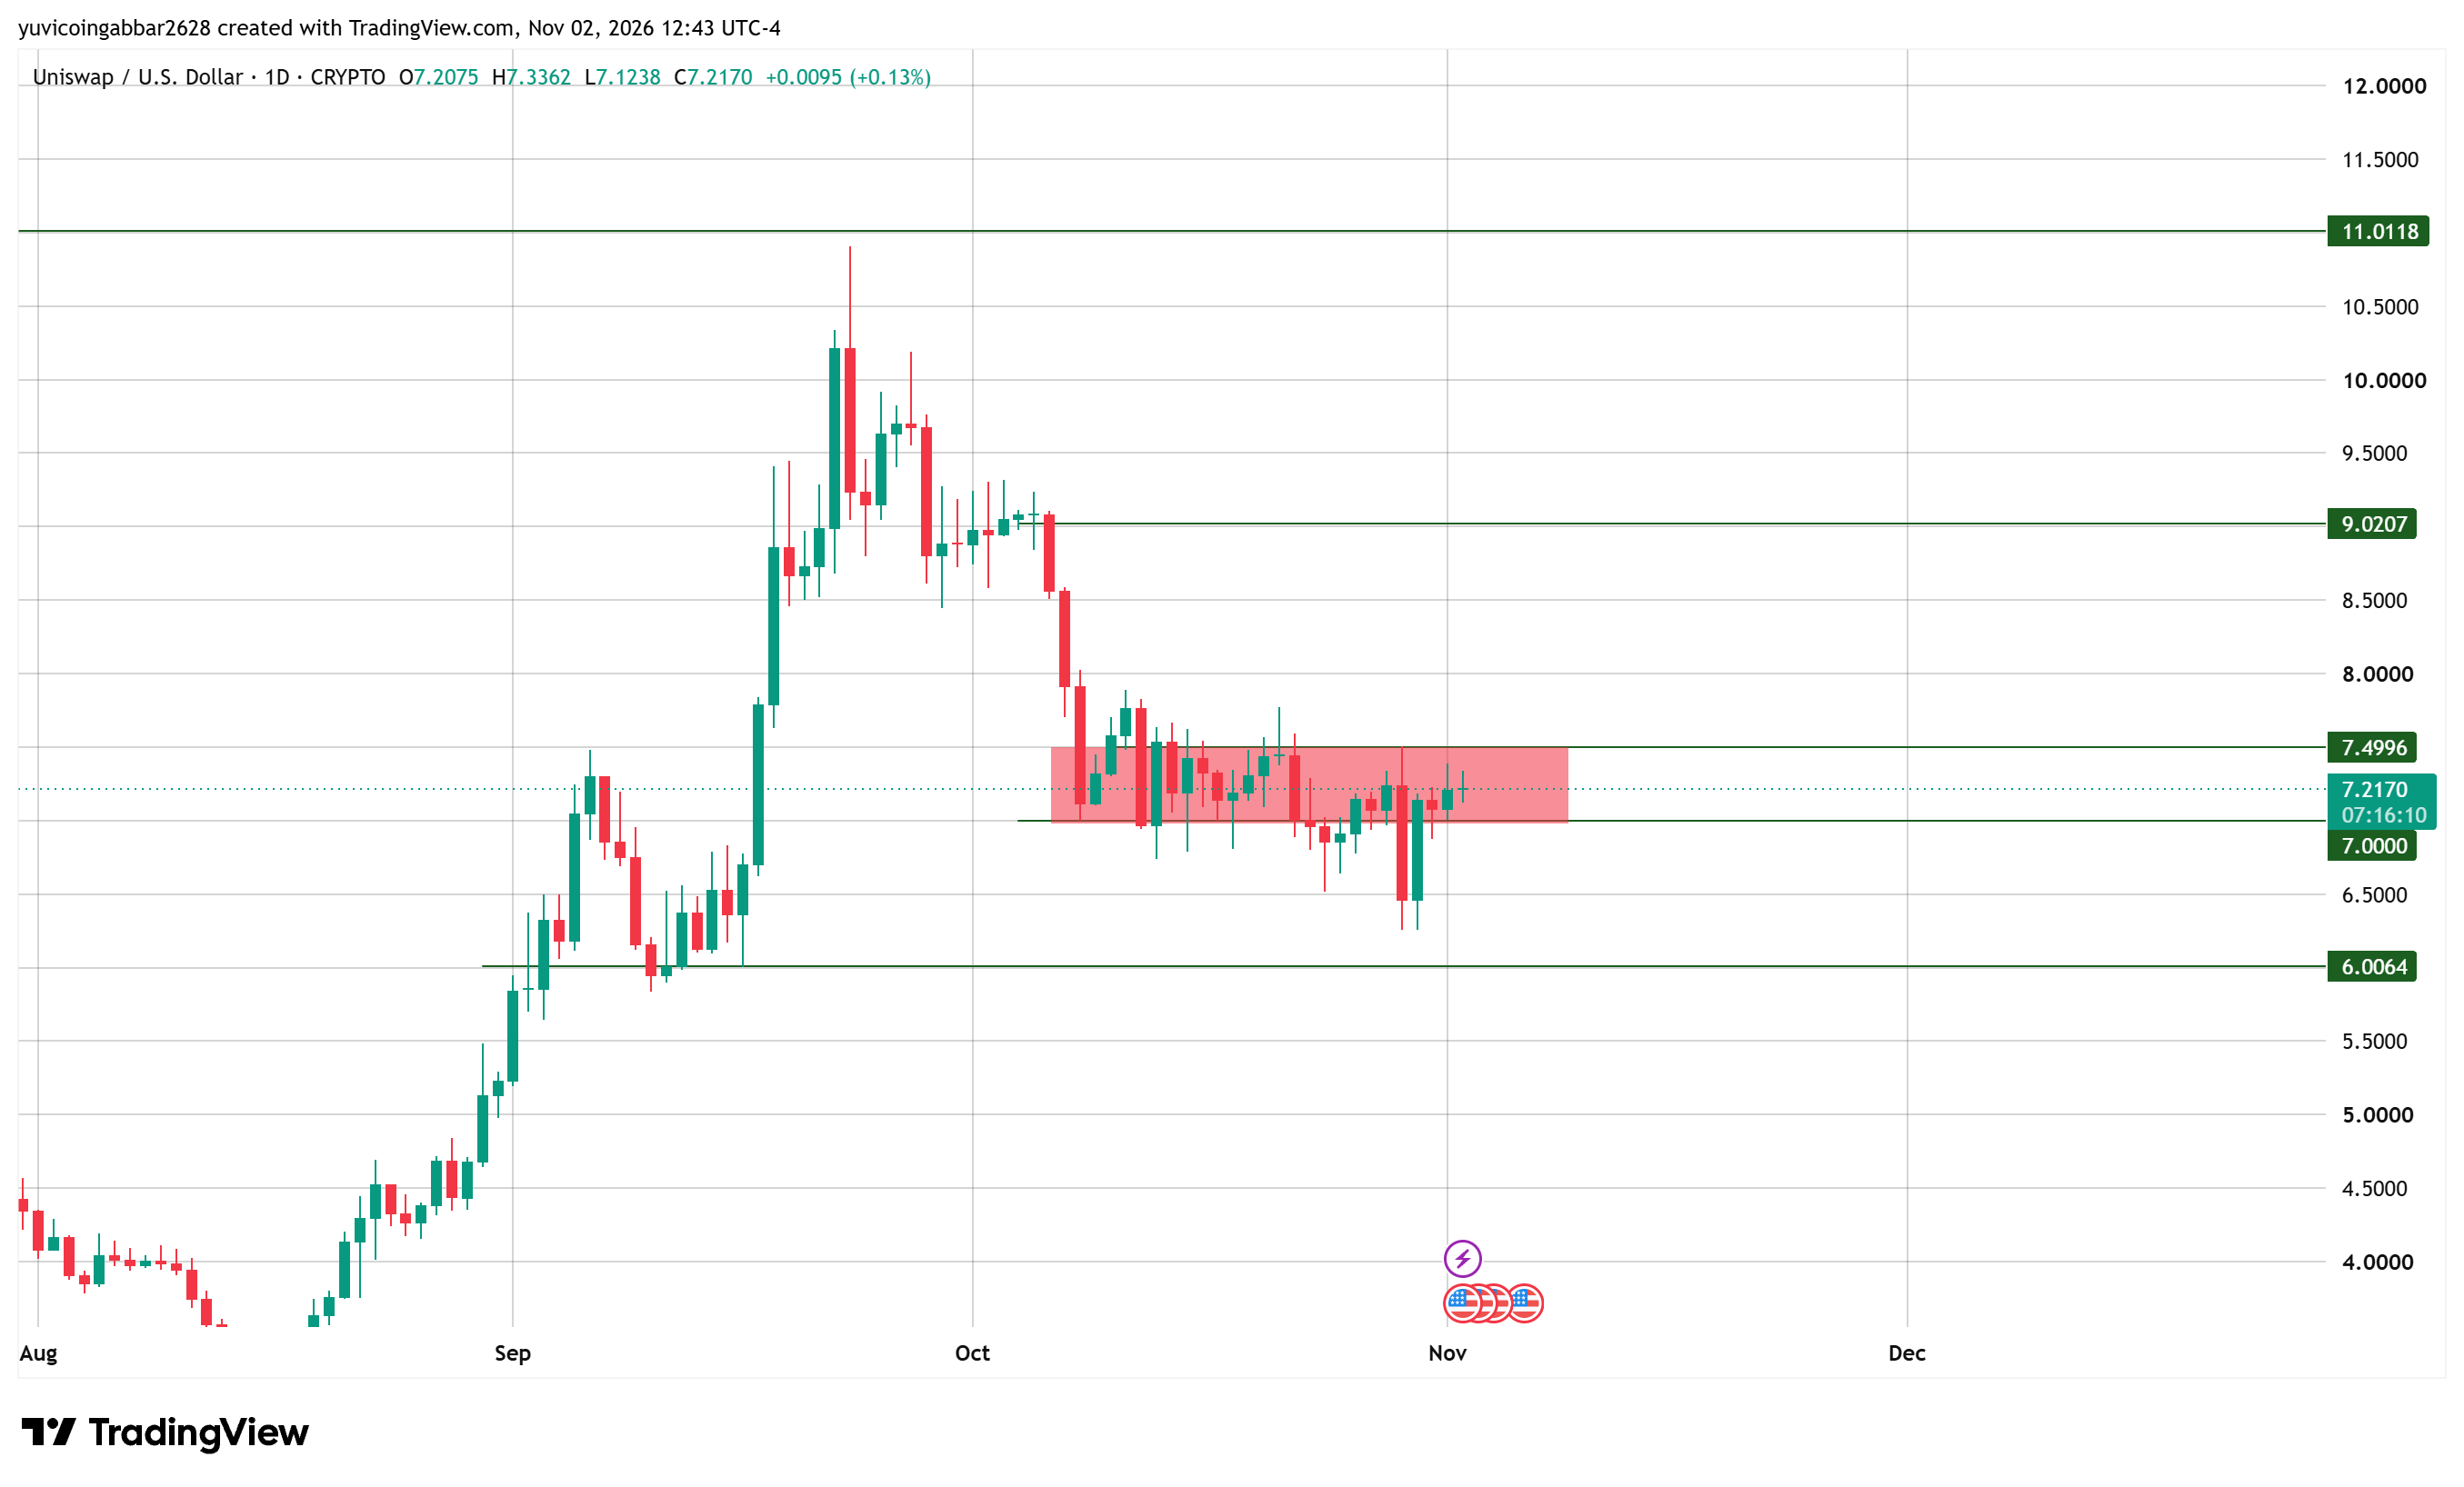
Pair: Uniswap/U.S. Dollar · Exchange: CRYPTO (TradingView's crypto feed) · Timeframe: 1D · Source: TradingView · Timestamp: November 2, 2026, 12:43 UTC-4
$UNI rose from about $4 in August to a high near $11 in late September. It then fell sharply and, since early October, has moved sideways between support at $7.0000 and resistance at $7.4996. The chart marks that band in red.
In late October, a daily candle dropped to about $6.26, well under $7.00, by eye. The price closed back inside the band the next day.
A move below support that reverses quickly is called a failed breakdown. It shows buyers defended the floor, though it is not a breakout.
Today's candle opened at $7.2075, ranged from $7.1238 to $7.3362 and printed $7.2170. It was still open, so the close can change.
Uniswap Forecast: Support and Resistance Levels
Type | Level |
Highest marked level | $11.0118 |
Resistance 2 | $9.0207 |
Resistance 1 | $7.4996 |
Immediate support | $7.0000 |
Deeper support | $6.0064 |
Bull case: A daily close above $7.4996, about 4% higher, would end the range and put $9.0207 in view, about 25% above today's price.
Bear case: If UNI closes below $7.0000, about 3% lower, the price could slide about 17% toward $6.0064.
UNI Scenarios and Invalidation (November 2, 2026)
Scenario | Trigger | Likely Outcome | Invalidation |
Bull | Close above $7.4996 | Move toward $9.0207 | Close back below $7.0000 |
Base | Range of $7.0000 to $7.4996 | Sideways inside the band | Break of either level |
Bear | Close below $7.0000 | Slide toward $6.0064 | Close back above $7.0000 |
Can Uniswap Reach $11.0118?
It would take a gain of about 53% from $7.2170. Any UNI price prediction toward that level needs more than a shift in positioning, since UNI must clear $7.4996 and $9.0207 first.
Uniswap Price Prediction: CoinGabbar Technical
UNI is range-bound, and the failed dip is a small positive. But the band is a few weeks old, and the price has not closed above $7.4996.
The post is a view, not data. The level to watch is $7.0000. A daily close below it would open $6.0064, while a close above $7.4996 would be the first real sign of strength.
Data Sources
Price and chart: TradingView (Uniswap/USD, 1D). News: a post on X by CW (@CW8900).
Disclaimer: This article is for informational purposes only and isn't financial advice. Crypto markets are volatile. Always do your own research before making any trading decisions involving UNI.