Uniswap Price Prediction: Can $6.1B Fee Milestone Lift UNI Past $7.90?

Interest in the latest Uniswap price prediction is rising after the protocol passed $6.1 billion in cumulative fees.
The $UNI coin did not share the excitement, since it is down 2.1% over the last 24 hours.
$UNI now trades near $7.04, and traders want to know whether strong usage can finally show up in the price.
Uniswap launched in 2018 as a decentralized exchange on Ethereum, created by Hayden Adams, and its UNI governance token followed in 2020.
According to CoinGecko, Uniswap price today is $7.04, within a 24-hour range of $6.91 to $7.33. UNI ranks 26th by market capitalization at about $4.393 billion.
Live Uniswap Market Data
| Metric | Value |
| UNI Price | $7.04 |
| 24h Change | -2.1% |
| 24h Range | $6.91 to $7.33 |
| Market Cap | $4.393B |
| Market Rank | #26 |
Source: CoinGecko, as of October 29, 2026.
Uniswap News Today
Uniswap news today centers on fee generation. According to BSCN, citing DefiLlama data, the protocol has now generated $6.112 billion in cumulative fees.
The exchange earned nearly $89 million of that total over the past 30 days.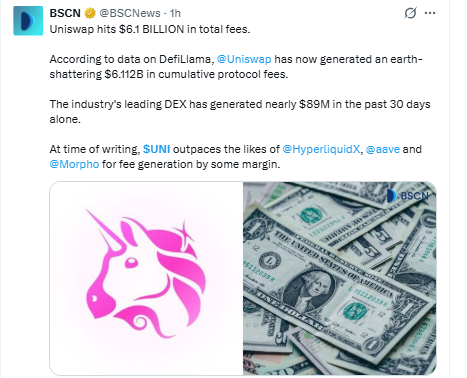
Source: Data Taken From @BSCNews , as of October 29, 2026.
The same report says UNI leads Hyperliquid, Aave and Morpho in fee generation by a clear margin at the time of writing.
Fees measure how much traders use the protocol, and they do not by themselves set the token price.
Uniswap Technical Analysis
This Uniswap price prediction October 2026 reads the 4-hour UNI/USDT chart on Binance.
Price is forming an ascending triangle, with a flat top near $7.26 and a rising trendline that connects the lows since October 24.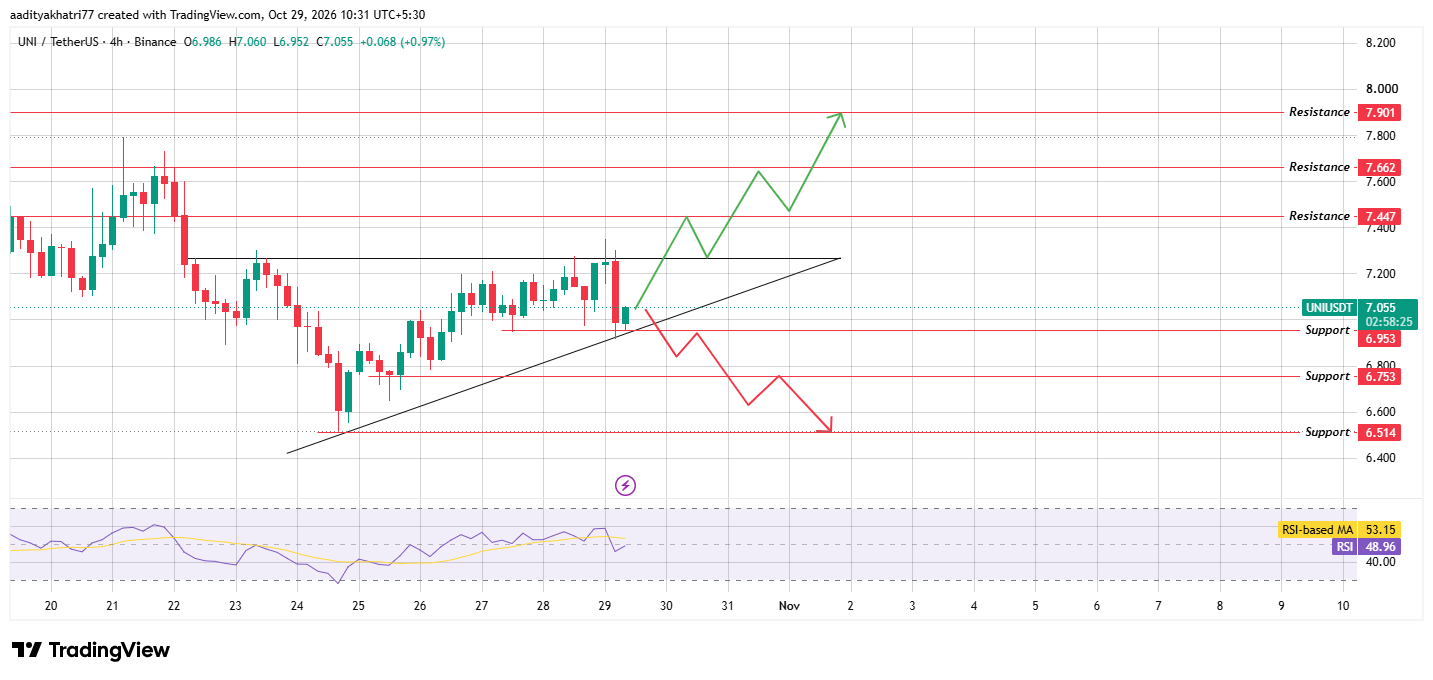
Source: Chart Taken From TradingView , UNI/USDT 4H, Binance, UTC+5:30, as of October 29, 2026.
$UNI reached about $7.80 on October 21 and 22, then fell to roughly $6.51 before recovering through a series of higher lows.
A sharp 4-hour drop earlier today carried price from near $7.25 to $6.95, where it met both the rising trendline and the $6.953 level.
The current candle opened at $6.986 and has traded between $6.952 and $7.060. The RSI reads 48.96 against its average of 53.15, which points to neutral momentum with a slightly soft tone.
Can $UNI Bounce and Break the $7.26 Flat Top?
The bullish case begins with a hold. UNI needs to keep the rising trendline and the $6.953 level intact, since the bounce from that area shows buyers still defend the structure.
The next step is a 4-hour candle close above the flat top near $7.26 on volume above the 20-period average. A close on weak volume would carry less weight, because the flat top has already turned price away several times.
After a confirmed break, $7.447 is the first resistance, followed by $7.662 and $7.901. The $7.901 level sits close to the October 21 and 22 highs, so sellers may appear again in that area.
What Happens If $UNI Breaks the Trendline and $6.953?
The bearish case starts when the bounce fails. If a 4-hour candle closes below both the rising trendline and $6.953, the triangle loses its upward slope and the pattern turns negative.
Confirmation needs above-average volume on that close. In that case, $6.753 is the first support, followed by $6.514, which matches the October low.
A brief move under the trendline is not enough. If price closes back above it within a few candles, the move may prove a false break, and the triangle would stay intact.
Price Levels to Watch
| Support | Resistance |
| $6.953 | $7.447 |
| $6.753 | $7.662 |
| $6.514 | $7.901 |
Bull, Base, and Bear Scenarios for Uniswap Price Prediction
| Scenario | Setup | Level |
| Bull | Bounce from the trendline, then a 4-hour close above the flat top near $7.26 on above-average volume | $7.447, $7.662, then $7.901 |
| Base | Price stays inside the triangle between the rising trendline and the flat top | $6.953 to $7.26 |
| Bear | 4-hour close below the rising trendline and $6.953 on above-average volume | $6.753, then $6.514 |
Uniswap vs Bitcoin
Any Uniswap price prediction 2026 should check how $UNI trades against Bitcoin and Ether.
Over the last 24 hours, UNI is down 2.1% in dollars, down 1.2% against Bitcoin and down 0.7% against Ether. Those figures imply that Bitcoin lost about 1% and Ether about 1.4% in dollar terms.
$UNI therefore fell a little more than both, so the weakness is partly market-wide and partly specific to the token. A stable market would help $UNI defend the rising trendline.
Methodology
This Uniswap price prediction draws on three inputs. Market data comes from CoinGecko and was taken on October 29, 2026.
The chart is a 4-hour UNI/USDT view from Binance in TradingView, with timestamps in UTC+5:30. Fee figures come from a BSCN post that cites DefiLlama.
Support and resistance levels were read directly from the chart. The flat top carries no label there, so the $7.26 figure is an approximate reading from the chart scale.
Trading volume, exchange flows and liquidation data were not part of this review, and the chart carried no moving averages. The scenarios describe possible paths and carry no assigned probabilities.
Expert Opinion
Fee data from DefiLlama, reported by BSCN, shows that Uniswap remains a leading decentralized exchange. The recent figure of nearly $89 million over 30 days works out to about $3 million per day.
As general market commentary, strong usage supports the long-term case for a protocol. Price often reacts to broader demand and to the way fees reach token holders.
Readers should check current governance details before assuming fees lift $UNI directly. In the short term, the $6.953 level will show whether buyers give the news weight.
Disclaimer: This article is for information only and is not financial advice. UNI is volatile, and price can fall below $6.514 if the rising trendline fails and broader market conditions weaken. No scenario here carries a stated probability, and a confirmed breakout can still reverse. Readers should do their own research and size any position to a loss they can accept.


















