XRP Price Outlook: Can $1.41 Hold as Evernorth's XRPN Hits Nasdaq?

Evernorth (XRPN) starts trading on Nasdaq on October 12. XRP is holding near $1.41, and every trader is watching one question.
Can it stay above $1.40 and push toward $1.50? This XRP price prediction looks at the news, the charts, and the derivatives data.
What Is the XRP Price Today?
The XRP price today is $1.4172, up 1.5% in 24 hours. Volume is rising fast.
Metric | Value |
Price | $1.4172 (+1.5%) |
Market cap | $89.32 billion |
Futures volume (24h) | $1.83 billion |
Spot volume (24h) | $299.49 million |
Open interest | $3.10 billion |
Circulating / max supply | 63.12 billion / 100 billion |
Why Is XRP in the News Today?
The latest XRP news is the XRPN Nasdaq listing. Evernorth closed its merger with Armada Acquisition Corp. II on Friday.
Armada II is a blank check company. Its own financials say little about the new business.
The deal and private placements raised over $1 billion. Backers include Ripple, SBI Group, Kraken, and Pantera Capital.
Note that the token itself is not listed on Nasdaq. Investors buy a company's stock instead.
What Is Evernorth XRPN and Does It Matter for XRP?
Evernorth XRPN holds about 473 million tokens and roughly $300 million in gross cash. At today's price, the tokens alone are worth about $670 million.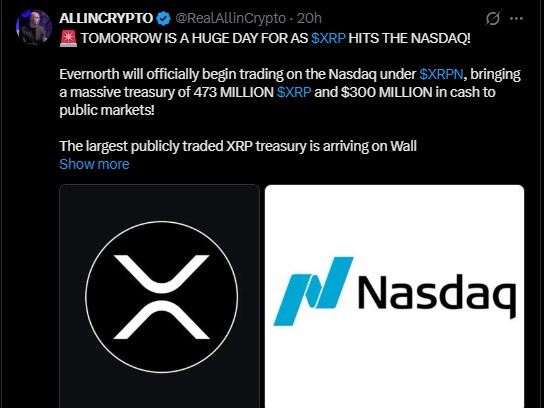
It calls itself an actively managed Ripple XRP treasury. Plans include institutional lending, DeFi, and liquidity provisioning to earn yield.
Some see a blueprint for other treasury firms. Others want to see how the stock trades first.
ETFs tracking the token already exist and are said to be doing well. No fresh XRP ETF inflow numbers were available, so none are quoted here.
Is XRP Going Up or Down? XRP Technical Analysis
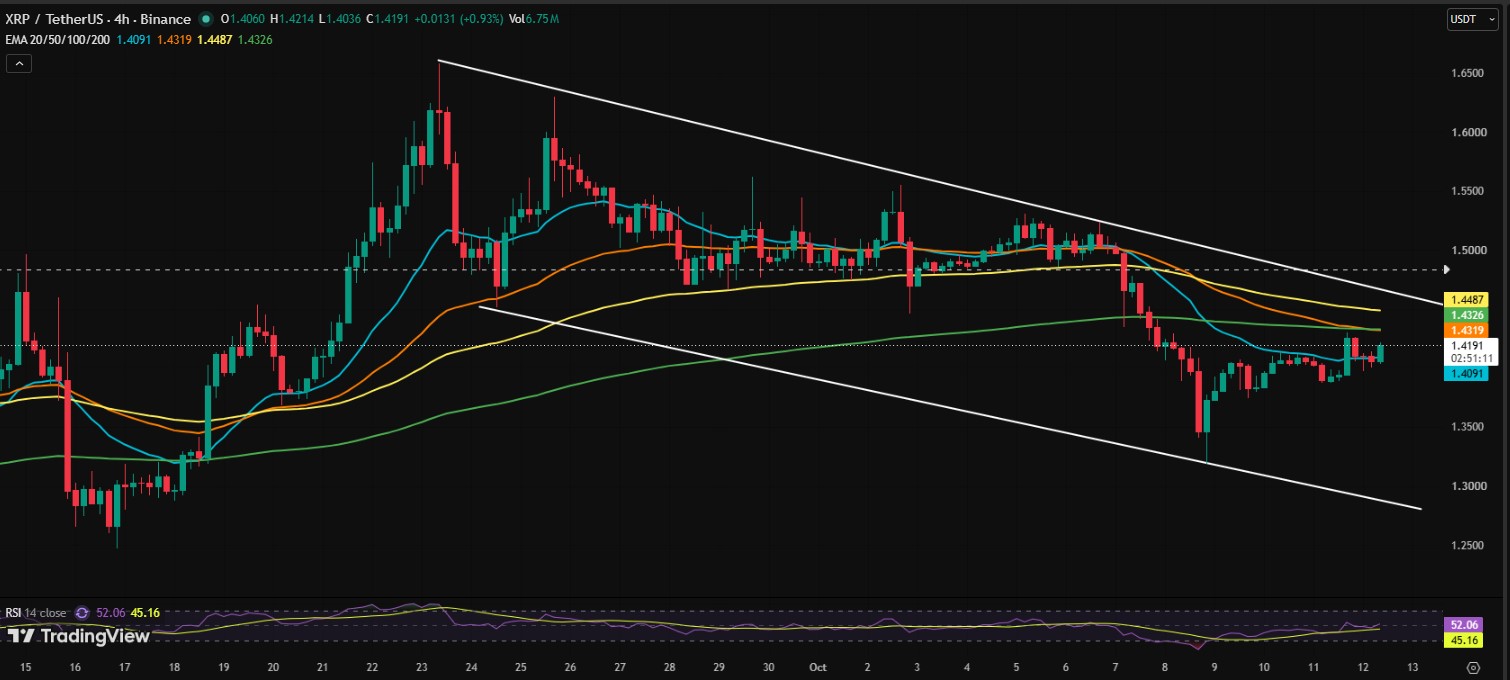
The 4-hour chart shows a descending channel. Price was rejected near $1.52 to $1.55, fell to about $1.34, then bounced.
At $1.4191, price is above the 20 EMA but below the 50, 100, and 200 EMAs. The short-term view stays cautious.
RSI is near 52. Momentum is recovering, but slowly.
Indicator | Reading |
20 EMA | $1.4091 |
50 EMA | $1.4319 |
100 EMA | $1.4487 |
200 EMA | $1.4326 |
RSI (14) | 52.06 |
What Are the XRP Support and Resistance Levels?
For XRP support and resistance, bulls must first clear the EMA cluster.
Type | Level | Note |
Resistance | $1.433 to $1.45 | EMA zone |
Resistance | $1.47 to $1.50 | Next targets |
Support | $1.40 to $1.38 | Short-term floor |
Support | $1.34 | Recent low |
Weekly support | $1.24, $1.06 | Deeper levels |
Weekly resistance | $1.67 | Major breakout |
A sustained move above $1.45 to $1.47 helps bulls. A drop under $1.38 makes more losses likely.
What Do XRP Derivatives Data Show?
XRP derivatives data looks mixed. The 24-hour long/short ratio is 0.9275, so shorts hold a slight edge overall.
Account ratios lean long. Binance shows 2.319, and OKX shows 3.05. Binance top traders sit at 2.6928 by accounts and 2.0738 by positions.
Window | Total liquidations | Longs | Shorts |
4 hours | $169.95K | $78.93K | $91.02K |
12 hours | $493.94K | $322.90K | $171.04K |
24 hours | $1.78M | $351.43K | $1.43M |
The 12-hour window hurt longs more. Over 24 hours, shorts took the bigger hit.
Open interest rose 1.76% to $3.11 billion. Options volume jumped 429.48% to $8.30 million, and options open interest is $66.77 million.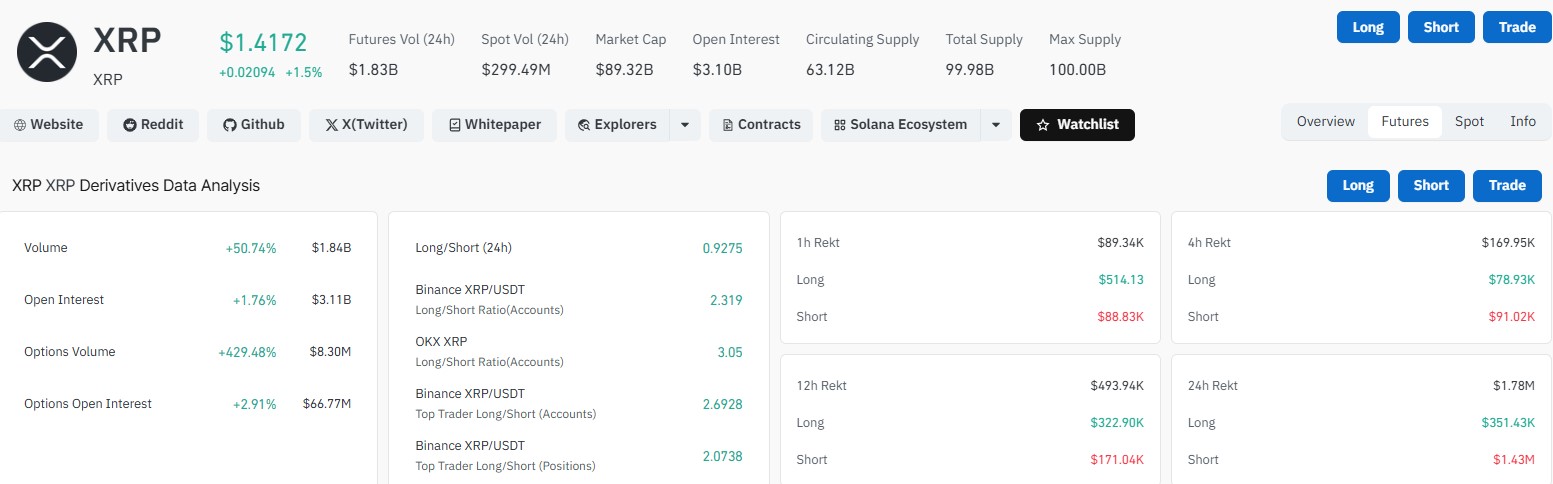
Will XRP Break Out? XRP Price Forecast and Weekly Targets
One analyst sees a repeating weekly pattern. In 2018 to 2020 and 2021 to 2024, a fourth touch of a falling trendline came before a big move.
The 2025 to 2026 structure has three touches so far. A fourth may be forming.
This XRP price forecast needs a weekly breakout above $1.67 first. The analyst lists $3.57, $9.36, and $15.47, with an extension to $31.86.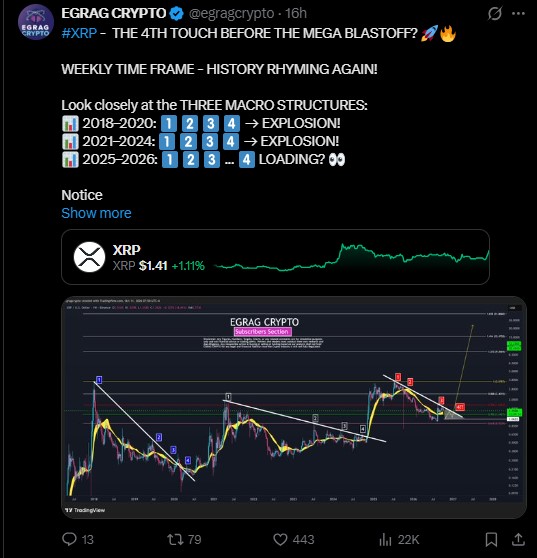
Those are not guarantees, and history does not always repeat. The bigger trend is called bullish; the short-term trend is corrective.
Disclaimer
This article is for information only. It is not financial, investment, or trading advice. Crypto prices are highly volatile, and you can lose money. Do your own research and speak to a licensed financial advisor before you invest.

















