Zcash Price Prediction: Whale Buy $31.9M in ZEC! Can ZEC Hit $2K Next?

Whales are buying ZEC again, and one post asks if $2,000 is next. A $31.9 million buying spree is the kind of news that makes traders afraid of missing the next run.
This Zcash price prediction covers the whale claim, the liquidation data, and the levels on the chart.
Market data was checked on October 12, 2026, at 01:00 UTC-3.
Zcash Price Prediction Today: Market Overview
Metric | Value |
Price | $1,282.31 |
Change | +5% |
Zcash News Today: $ZEC Liquidation and Futures Volume Data
A liquidation happens when an exchange force-closes a leveraged trade because the trader can no longer cover the loss. A long bet on a rise and a short bet on a fall.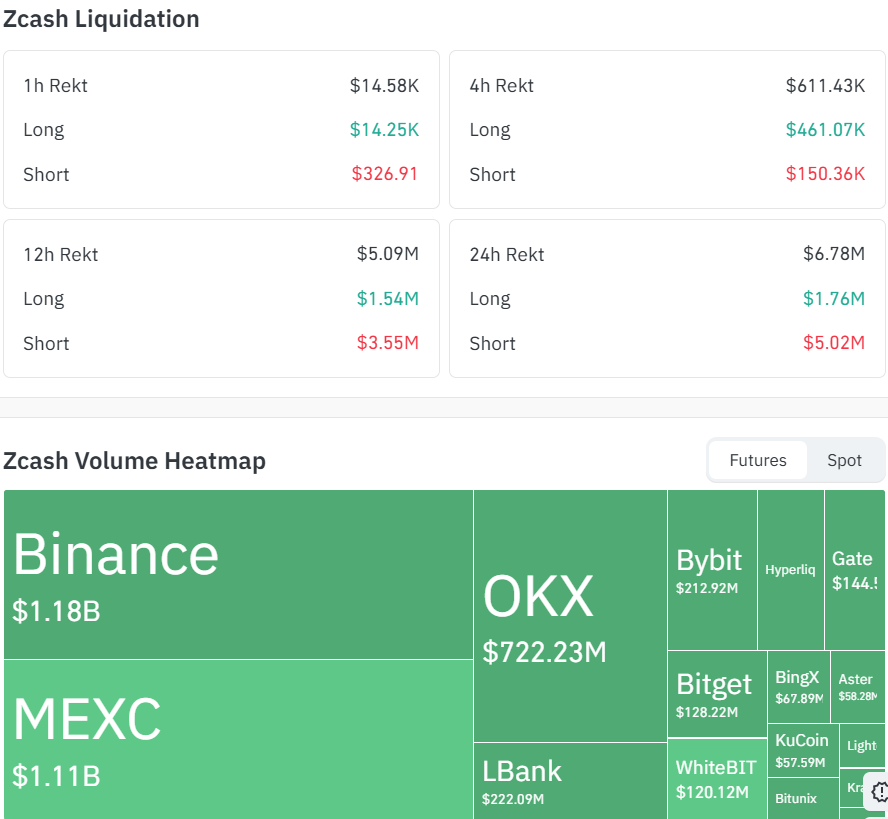
Window | Total | Long | Short |
1h | $14.58K | $14.25K | $326.91 |
4h | $611.43K | $461.07K | $150.36K |
12h | $5.09M | $1.54M | $3.55M |
24h | $6.78M | $1.76M | $5.02M |
Shorts made up about 74% of the 24-hour total. The latest 4 hours flipped, with longs at about 75%. Rising prices can force short sellers out of trades.
Exchange | Futures Volume |
Binance | $1.18B |
MEXC | $1.11B |
OKX | $722.23M |
Source: Coinglass futures data, top three exchanges shown, separate from spot volume.
Why Is Zcash Price Up Today?
The Zcash price today is up 5% to $1,282.31 in 24 hours, significantly outperforming a modestly positive broader market. The move appears primarily driven by a derivatives-led short squeeze, amplified by a technical breakout on surging volume.
Primary reason: A cascade of short liquidations, removing $6.1 million in bearish bets and forcing a rapid price rebound.
Secondary reasons: A technical breakout from consolidation, confirmed by a near-doubling of trading volume to $884 million.
Zcash News: Whales Reportedly Buy $31.9 Million of $ZEC
Data from Akram says a whale, meaning a holder with a very large amount of crypto, bought 17,770 $ZEC (21.76million) on Binance and 8,300 $ZEC (10.17 million) on Kraken, while Grayscale is selling. It also mentions a January 2027 quantum-resistant target.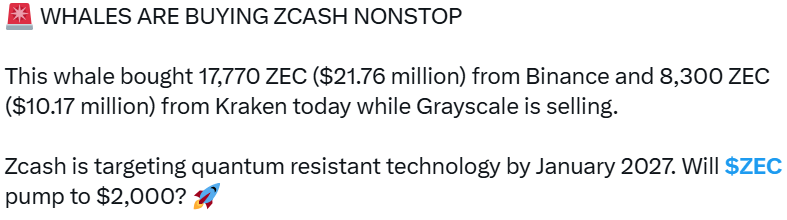
The post's figures imply about $1,225 per $ZEC, below the current price, so the buys may be from an earlier session.
CoinGabbar could not independently verify the purchases or the Grayscale claim.
Zcash Technical Analysis
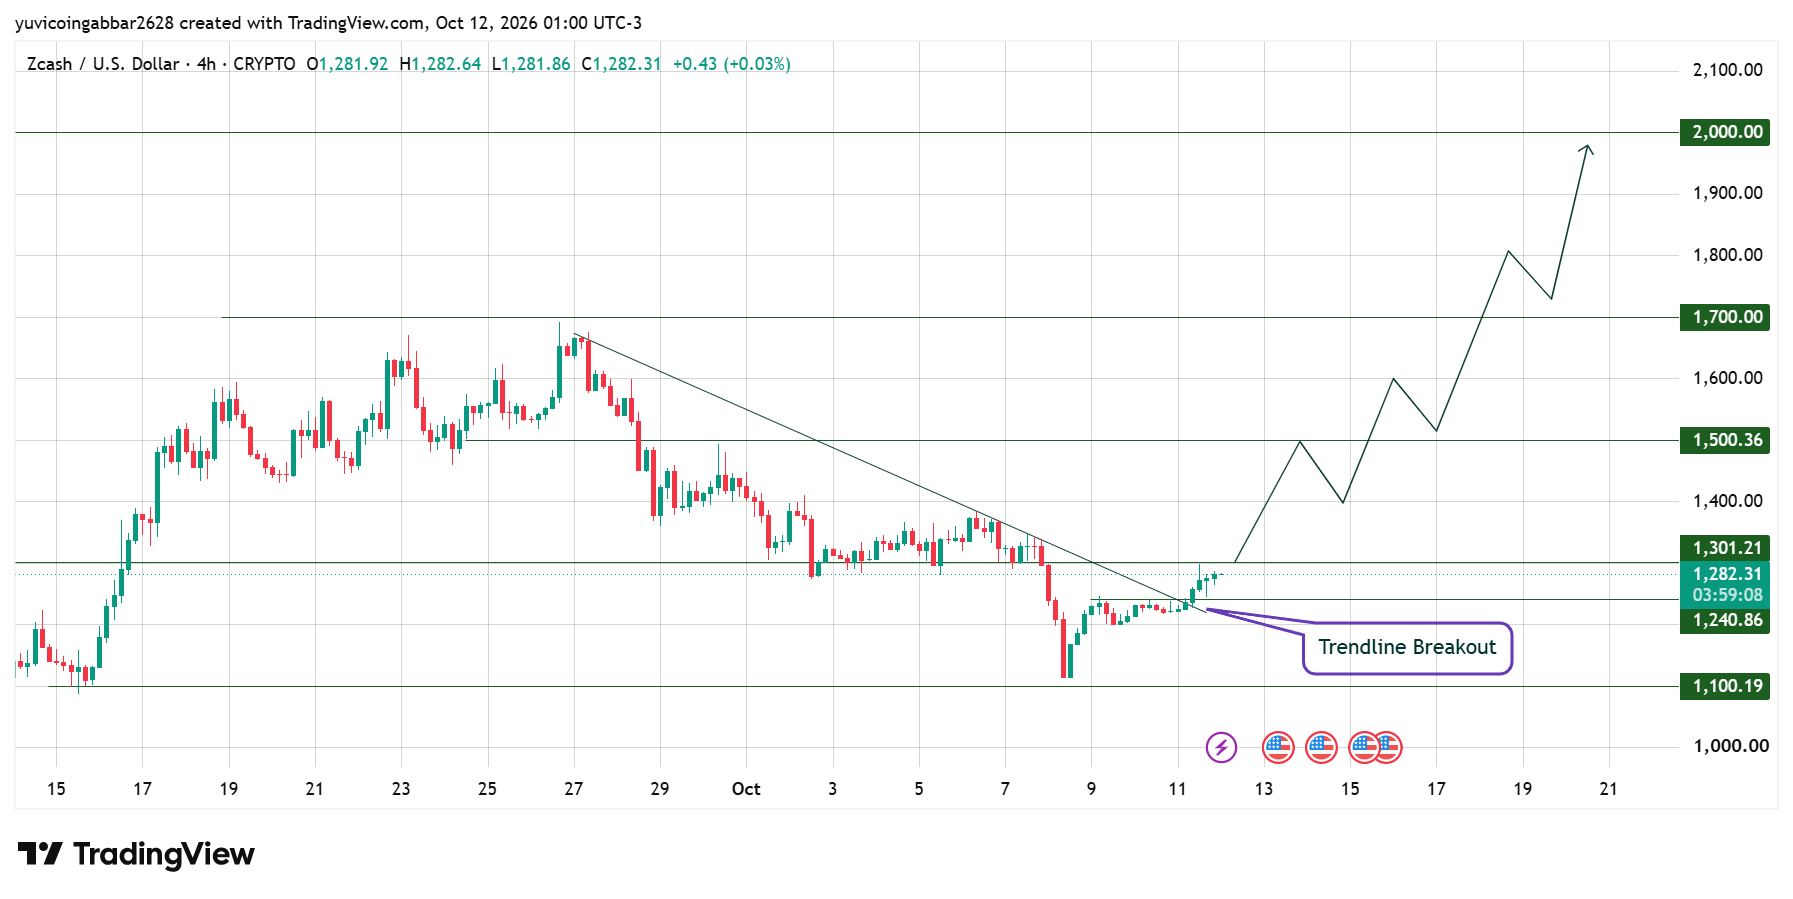
$ZEC peaked near $1,700 in late September, then fell along a downward trendline to a low near $1,100.19 on October 8. Price has since climbed and moved above that trendline, which the chart labels a trendline breakout.
It is still early, because ZEC trades below $1,301.21. The path drawn on the chart heads toward $2,000.00.
The key is for the price to hold the trendline and break above the upper resistance level to open the path toward $2,000.
ZEC Support and Resistance Levels in This ZEC Forecast
Level | Type |
$2,000.00 | Resistance (highest marked) |
$1,700.00 | Resistance |
$1,500.36 | Resistance |
$1,301.21 | Resistance (nearest) |
$1,240.86 | Support (first) |
$1,100.19 | Support (deeper) |
Support is an area where buyers have stepped in before. Resistance is an area where sellers have pushed prices down before.
Zcash Outlook: Triggers and Invalidation
Scenario | Trigger | Likely Outcome | Invalidation |
Breakout holds | Close above $1,301.21 | Move toward $1,500.36 | Close below $1,240.86 |
Range builds | Trade between $1,240.86 and $1,301.21 | Base forms | Close outside the range |
Pullback | Close below $1,240.86 | Slide toward $1,100.19 | Reclaim $1,240.86 |
Zcash Price Prediction: Can $ZEC Reach $2,000?
ZEC would need to pass $1,301.21, $1,500.36 and $1,700.00 first. A move to $2,000.00 from $1,282.31 is a gain of about 56%, while $1,500.36 is about 17% away. The chart does not show that move yet.
Zcash Price Prediction 2026: Expert View
According to CoinGabbar analysts, ZEC went from a sharp drop to a trendline test within days, which shows buyers are active.
The whale claim is unverified, though, and $1,301.21 is still uncleared. A 4H close above it would be the next sign of momentum.
Disclaimer
This article is for informational purposes only and is not financial advice. Crypto markets are volatile. Do your own research before making any trading decisions involving ZEC.

















