Zcash Price Prediction: $1,000 at Risk! Will Whales Get Liquidated?


Will ZEC break $1,000? Not yet, but the chart is weaker. ZEC fell about 8% yesterday and through its rising trendline and $1,201.01 support and trades at $1,140.49.
In this Zcash price prediction, Longs took about 88% of the $13.61M liquidated in 24 hours. Two traders now point to $1,000: one calls it a decent area to buy, and the other says a break would wipe out big whales.
Market data checked on November 3, 2026, at 09:28 IST.
Why is Zcash price down today?
The Zcash price today is down 11% to $1,140.49 in 24 hours, significantly underperforming a falling Bitcoin, primarily driven by a reported selloff and leveraged liquidations.
Primary reason: A reported Kraken selloff and $13.7 million in leveraged long liquidations triggered immediate selling pressure.
Secondary reasons: Broader market stress from the Binance hack fallout and pre-upgrade volatility ahead of the NU7 hard fork, and also the price broke an important trendline.
Zcash News Today: Traders Watch $1,000
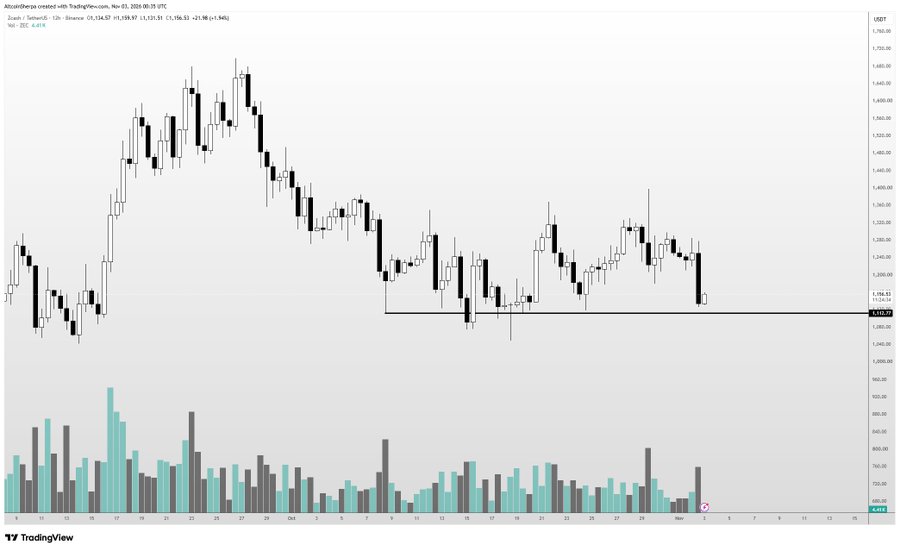
This is a decent area to buy, in his opinion. He says that if ZEC loses the area, it is probably "sub $1,000 time."
He adds that he holds a bag and is DCA-ing, buying fixed amounts at regular times. This is his view and a disclosed position, not a recommendation.
Source: Data From X
Zcash News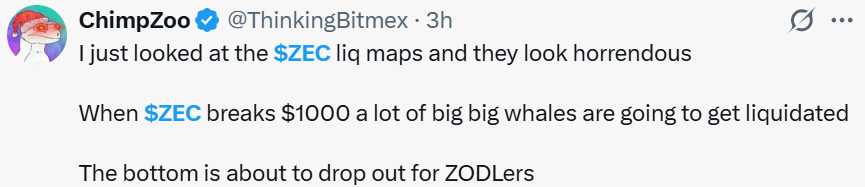
The ZEC liquid maps look horrendous. A liquidation map estimates where leveraged trades would be force-closed at each price.
He says that when ZEC breaks $1,000, a lot of big whales will be liquidated, and that the bottom is about to drop out for "ZODLers", a word the post does not explain.
Neither post shows data, and CoinGabbar could not verify them. The views differ but share one level. Our chart marks $1,001.28.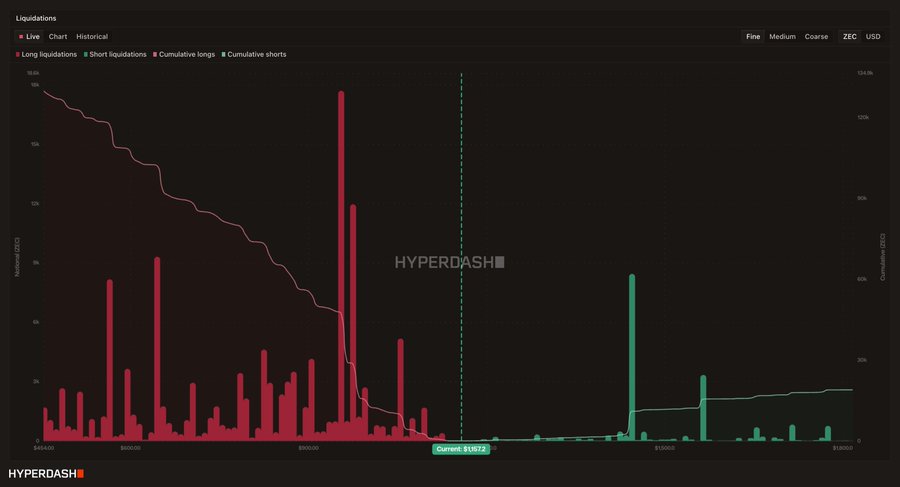
ZEC Liquidation Data
A liquidation happens when an exchange force-closes a leveraged trade because the trader can no longer cover losses. Longs bet on a rise, and shorts bet on a fall.
Window | Total Liquidated | Long | Short |
1h | $113.92K | $110.88K | $3.04K |
4h | $660.43K | $260.11K | $400.33K |
12h | $12.22M | $11.36M | $854.34K |
24h | $13.61M | $12.03M | $1.57M |
Source: Data From CoinGlass
Longs took about 88% of the $13.61M liquidated over 24 hours, and about 90% of that total came in the last 12 hours. This fits yesterday's sharp drop. Over the last 4 hours, shorts took about 61%, which fits today's small bounce.
Will Whales Get Liquidated if ZEC Breaks $1,000?
ZEC liquidation maps look horrendous and that a break of $1,000 would liquidate “big big whales”. A liquidation map estimates where leveraged trades would be force-closed at each price.
The data we have shows longs already took a hit. About $12.03M of the $13.61M liquidated in 24 hours came from longs, as ZEC fell through $1,201.01.
Our chart marks $1,100.60 as the first support, then $1,001.28, about 12% below $1,140.49. A close below $1,100.60 would put $1,001.28 in play.
Zcash Outlook: Technical Analysis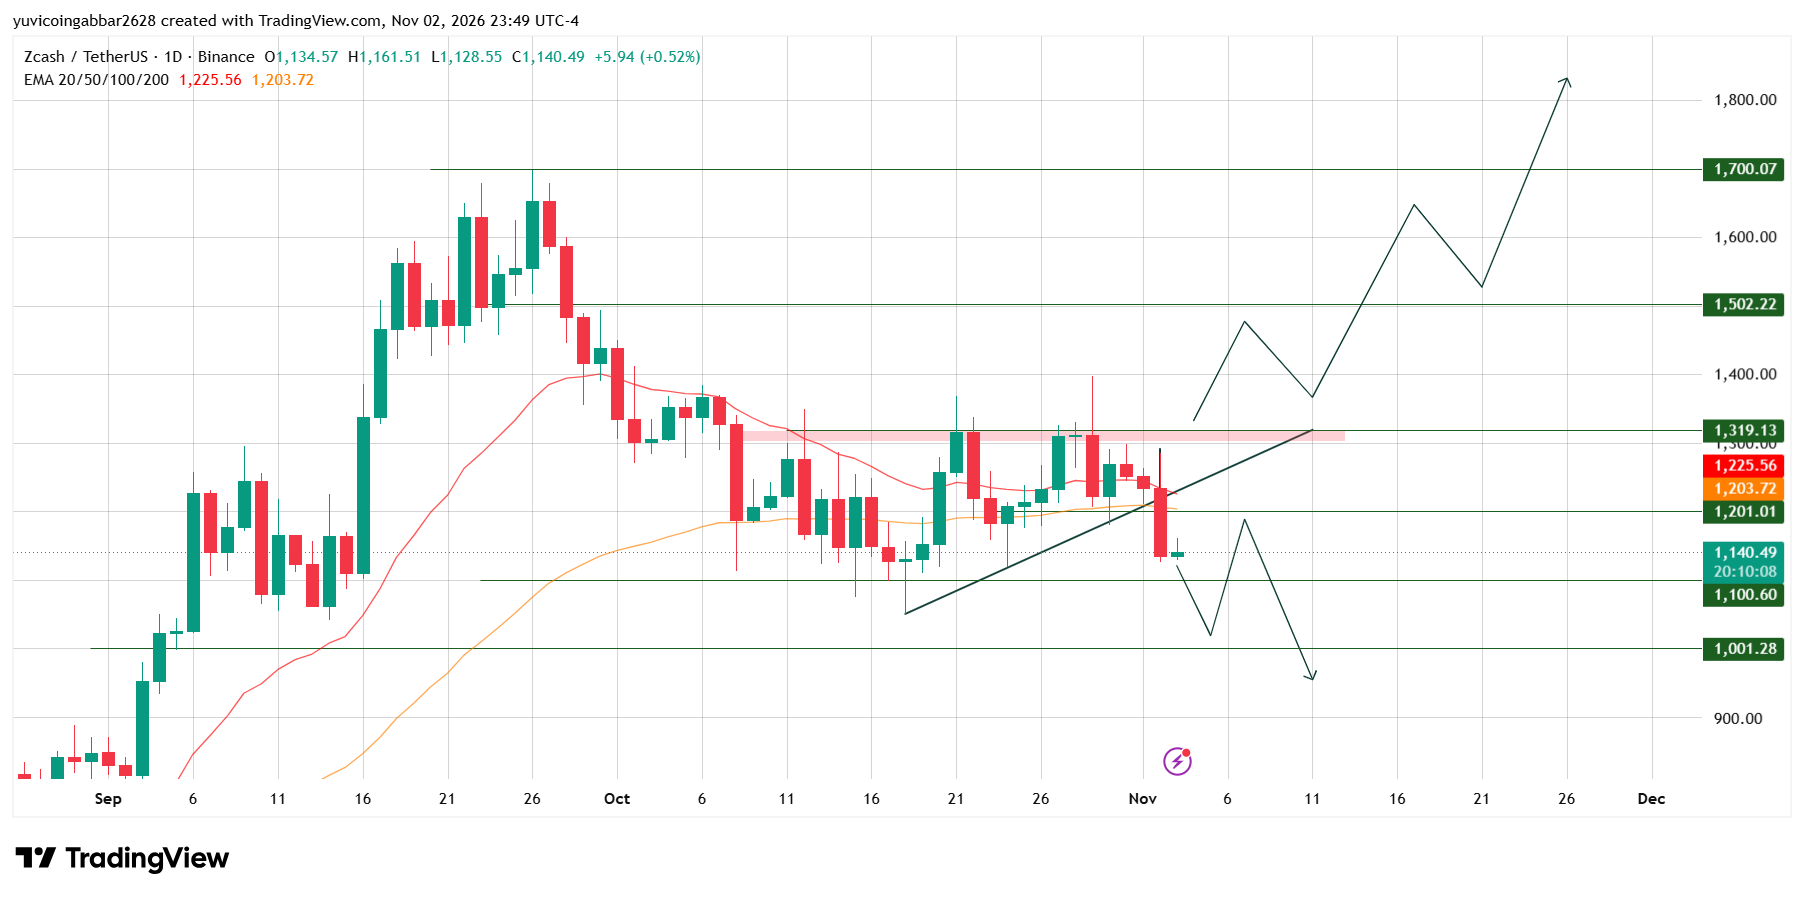
ZEC peaked near $1,700.07 in late September and fell to about $1,050 by mid-October. Since then, lows had risen along a trendline while rallies stalled under $1,319.13.
Yesterday's candle opened at $1,234.68 and closed near $1,134.57, a fall of about 8%. It broke the trendline and the $1,201.01 support. Price is about 11% below the $1,276.17 in our November 2 article.
In that article, Ardi's bearish path pointed to $1,100 after a break under the trendline and $1,210. That break has now happened.
Today's candle opened at $1,134.57, ranged from $1,128.55 to $1,161.51 and printed $1,140.49. It was still open, so the close can change.
An EMA, or exponential moving average, weights recent prices more heavily. Price is under both the 20 EMA at $1,225.56 and the 50 EMA at $1,203.72.
$ZEC failed to break resistance and is now breaking down out of its local consolidation. The measured target is around the $1,000 area, the zone is where the key support is.
Zcash Forecast: Support and Resistance Levels
Type | Level |
Highest marked level | $1,700.07 |
Resistance 3 | $1,502.22 |
Resistance 2 | $1,319.13 |
Resistance 1 | $1,201.01 |
Immediate support | $1,100.60 |
Deeper support | $1,001.28 |
Bull case: A daily close back above $1,201.01, about 5% higher, would bring the broken support back into play and put $1,319.13 in view.
Bear case: If $ZEC closes below $1,100.60, about 3% lower, the price could slide about 12% toward $1,001.28.
$ZEC Scenarios and Invalidation (November 3, 2026)
Scenario | Trigger | Likely Outcome | Invalidation |
Bull | Close above $1,201.01 | Move toward $1,319.13 | Close below $1,100.60 |
Base | Range of $1,100.60 to $1,201.01 | Sideways under the old support | Break of either level |
Bear | Close below $1,100.60 | Slide toward $1,001.28 | Close back above $1,100.60 |
Zcash Price Prediction: Can Zcash Reach $1,700.07?
It would take a gain of about 49% from $1,140.49. Any Zcash price forecast toward that level needs more than a bounce.
Zcash Price Prediction: CoinGabbar Technical View
The rising trendline has broken, and the price is under both EMAs. The small bounce does not change that. The level to watch is $1,100.60.
A daily close below it would open $1,001.28, where one trader expects liquidations. A close back above $1,201.01 would be the first real sign of strength.
Disclaimer
This article is for informational purposes only and isn't financial advice. Crypto markets are volatile. Always do your own research before making any trading decisions involving ZEC.