Zcash Price Prediction: Will $1,100 Hold Before ZEC Hit $2,000 Target?

ZEC keeps climbing, resting, then climbing again, and that bears should be nervous about $2,000. Anyone who sat out the last run knows how fast ZEC can move. Now it sits at another decision point.
This Zcash price prediction covers that view and the levels on the chart.
Market data checked on October 13, 2026 at 01:00 UTC-3.
Zcash Outlook: Market Overview
Metric | Value |
Price | $1,211.38 |
Change | -5% |
Zcash News Today: Trader Says $ZEC Keeps Breaking Out of Ranges
A post on X says $ZEC is moving as if it forgot there is supposed to be a top. It describes a repeating cycle of range, breakout, and new range, breakout, and says $ZEC is now in another range.
The trader adds that if it breaks upward again, $2K will start to look "real uncomfortable" for the bears. Bears are traders who bet on falling prices.
This is one trader's view. CoinGabbar could not independently verify how it will play out.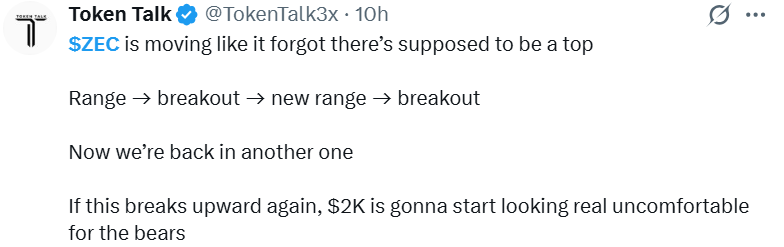
Source: Data From X
The chart fits part of the story. $ZEC peaked near $1,700 in late September. October then moved the other way, so the pattern has not been a straight line up.
Why is Zcash price down today?
The Zcash price today is down 5% to $1,211.38 in 24h, significantly underperforming a slightly down market, primarily driven by a cascade of leveraged long liquidations.
Primary reason: A leveraged long squeeze, with over $19 million in $ZEC positions liquidated amid a broader market dip.
Secondary reasons: Broader altcoin weakness and negative sentiment spillover from its association with a high-profile wallet-draining incident.
Zcash Liquidations Hit $31.73M as Long Positions Take the Biggest Hit
Zcash recorded $31.73 million in total liquidations over the past 24 hours, according to the provided Coinglass data. Long liquidations accounted for $21.44 million, while short liquidations reached $10.29 million, showing that bullish traders faced greater losses during this period.
Over the past 4 hours, total liquidations stood at $7.13 million, including $5.89 million in longs and $1.24 million in shorts.
This imbalance suggests that downward price pressure forced more long positions to close, although liquidation data alone does not confirm the next price direction.
ZEC Technical Analysis
After the late-September peak, $ZEC fell along a downward trendline to a low near $1,100.19 on October 8. Price then climbed, moved above the trendline around October 11, and briefly pushed above $1,320.14 on October 12.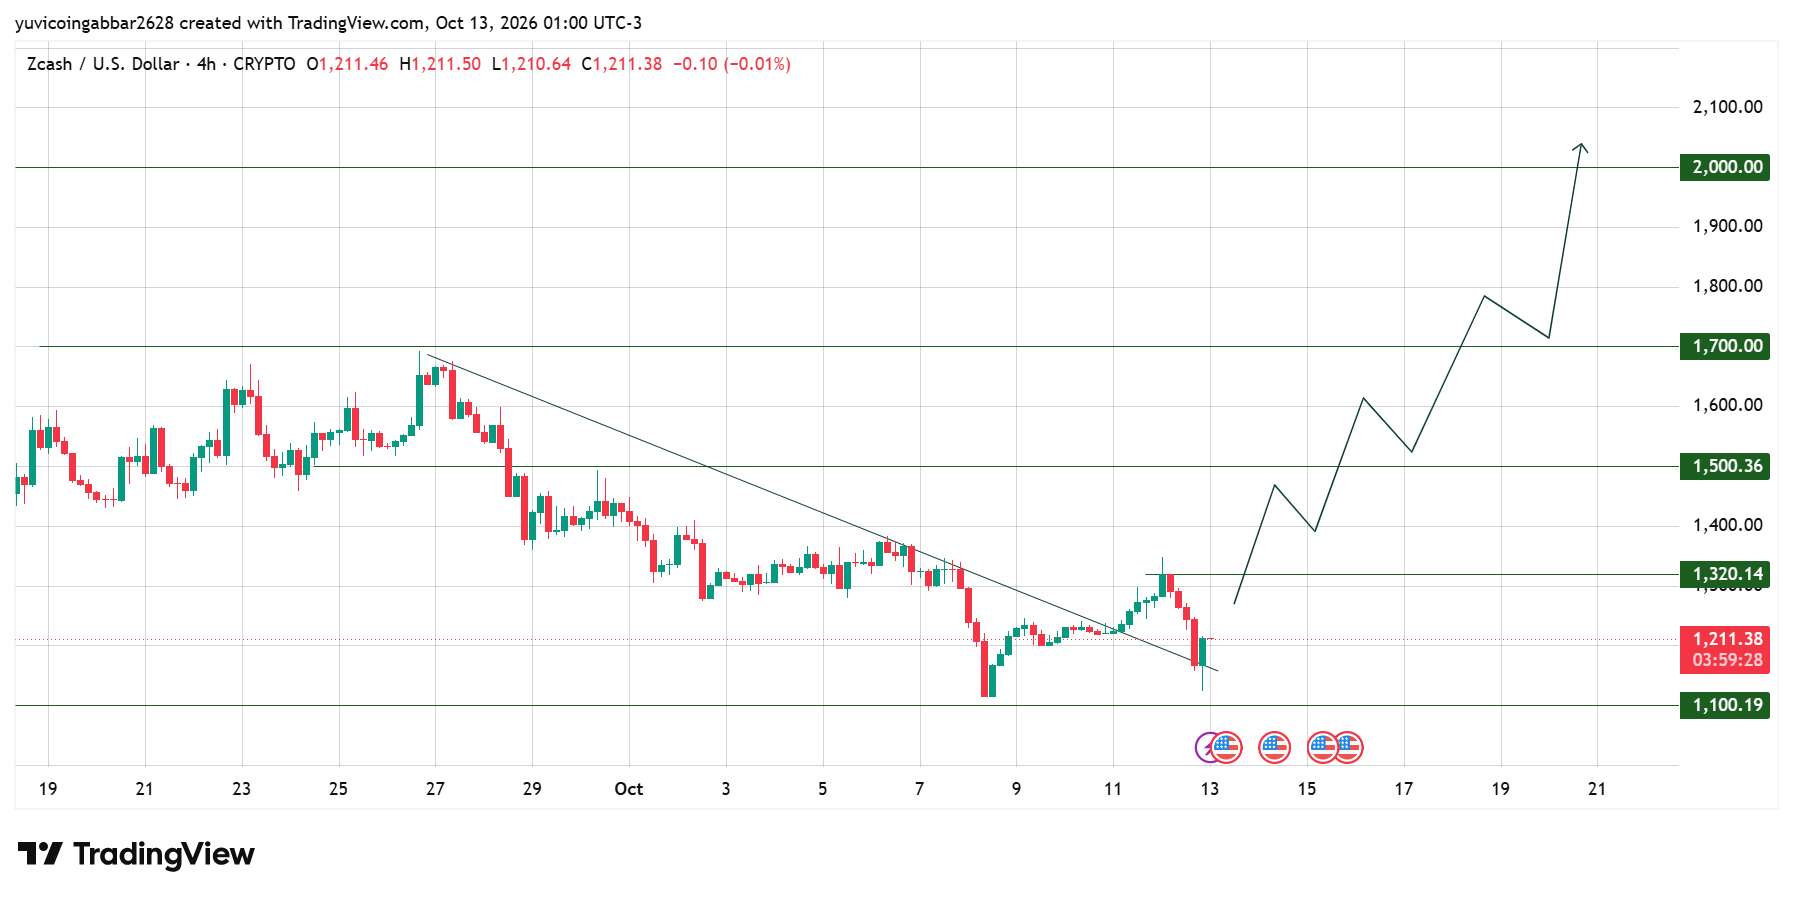
$ZEC has since fallen back to the trendline, dipped below it, and recovered. This is a retest, meaning the price returns to a broken level to see if it holds. At $1,211.38, ZEC is still above the trendline, but the test is not finished.
$ZEC Support and Resistance Levels in This ZEC Forecast
Level | Type |
$2,000.00 | Resistance (highest marked) |
$1,700.00 | Resistance |
$1,500.36 | Resistance |
$1,320.14 | Resistance (nearest) |
$1,100.19 | Support (only marked) |
Zcash Forecast: Triggers and Invalidation
Scenario | Trigger | Likely Outcome | Invalidation |
Retest holds | Closes stay above the trendline, then close above $1,320.14 | Move toward $1,500.36 | Close below the trendline |
Range builds | Trade between $1,100.19 and $1,320.14 | Base forms | Close outside the range |
Breakdown | Close below $1,100.19 | More downside, no marked support below | Reclaim $1,100.19 |
Zcash Price Prediction: Can $ZEC Reach $2,000?
$ZEC would need to pass $1,320.14, $1,500.36 and $1,700.00 first. A move to $2,000.00 from $1,211.38 is a gain of about 65%, while $1,500.36 is about 24% away.
Zcash Price Prediction 2026: Expert View
According to CoinGabbar analysts, the trader's range-and-breakout story fits September, but October moved the other way, so a repeat is not guaranteed.
$ZEC is testing the trendline it just broke, and that test matters more than the $2,000 headline. A hold keeps the upside path open, while a close below the line weakens it.
Disclaimer
This article is for informational purposes only and is not financial advice. Crypto markets are volatile. Do your own research before making any trading decisions involving $ZEC.

















