Zcash Price Prediction: "Dream Entry" Setup? Can $ZEC Hit 2K Next?


After a brutal slide, one trader is calling the current ZEC price a "dream entry." The Zcash price today is trading at $1,220.40, down 5.5%, bouncing slightly after tumbling from highs near $1,700 just two weeks ago.
This Zcash price prediction looks at that bottom-calling thesis and what the chart itself shows after the drop.
Market data checked on October 9, 2026.
Zcash Outlook: Why ZEC Is Down Today
The Zcash price today is down 5.5% to $1,220.40 in 24 hours, underperforming a broadly weaker crypto market, primarily driven by institutional profit-taking via ETF outflows. The decline was exacerbated by a cascade of leveraged long liquidations.
Primary reason: Sustained outflows from Grayscale's spot Zcash ETF (ZCSH), indicating institutional profit-taking after a massive rally.
Secondary reasons: A derivatives-driven liquidation cascade, with over $13.6 million in ZEC long positions forcibly closed, accelerating the sell-off.
Zcash News: Trader Calls Current Price a "Dream Entry"
A post from Altcoin Sherpa says the current pullback "appears" to be a dream entry for ZEC, noting that while altcoins broadly look weak right now, Zcash's drop still stood out as surprising.
The trader says they're watching for the price to find a bottom and then consolidate for a few weeks, calling that the healthier outcome from here.
Source: Data From X
This is one trader's opinion based on their own read of the chart, not a confirmed call, and CoinGabbar could not independently verify how the setup will play out.
Crypto News Today: ZEC Liquidations Flip From Longs to Shorts
Window | Total Liquidated | Long | Short |
1h | $246.84K | $5.04K | $241.80K |
4h | $1.18M | $48.16K | $1.13M |
12h | $5.91M | $2.00M | $3.92M |
24h | $45.73M | $40.40M | $5.33M |
Source: Data From CoinGlass
Over the past 24 hours, longs took the overwhelming majority of liquidations, reflecting the scale of the decline.
But the most recent 1h and 4h windows have flipped sharply toward shorts, suggesting a short-term squeeze may be underway as price attempts this early bounce.
Zcash Technical Analysis
ZEC fell sharply from a high near $1,700 in late September to a low near $1,100 on October 8 and is now showing an early bounce to $1,220.40 on a candle that opened at $1,215.83 and ranged between $1,215.82 and $1,222.56.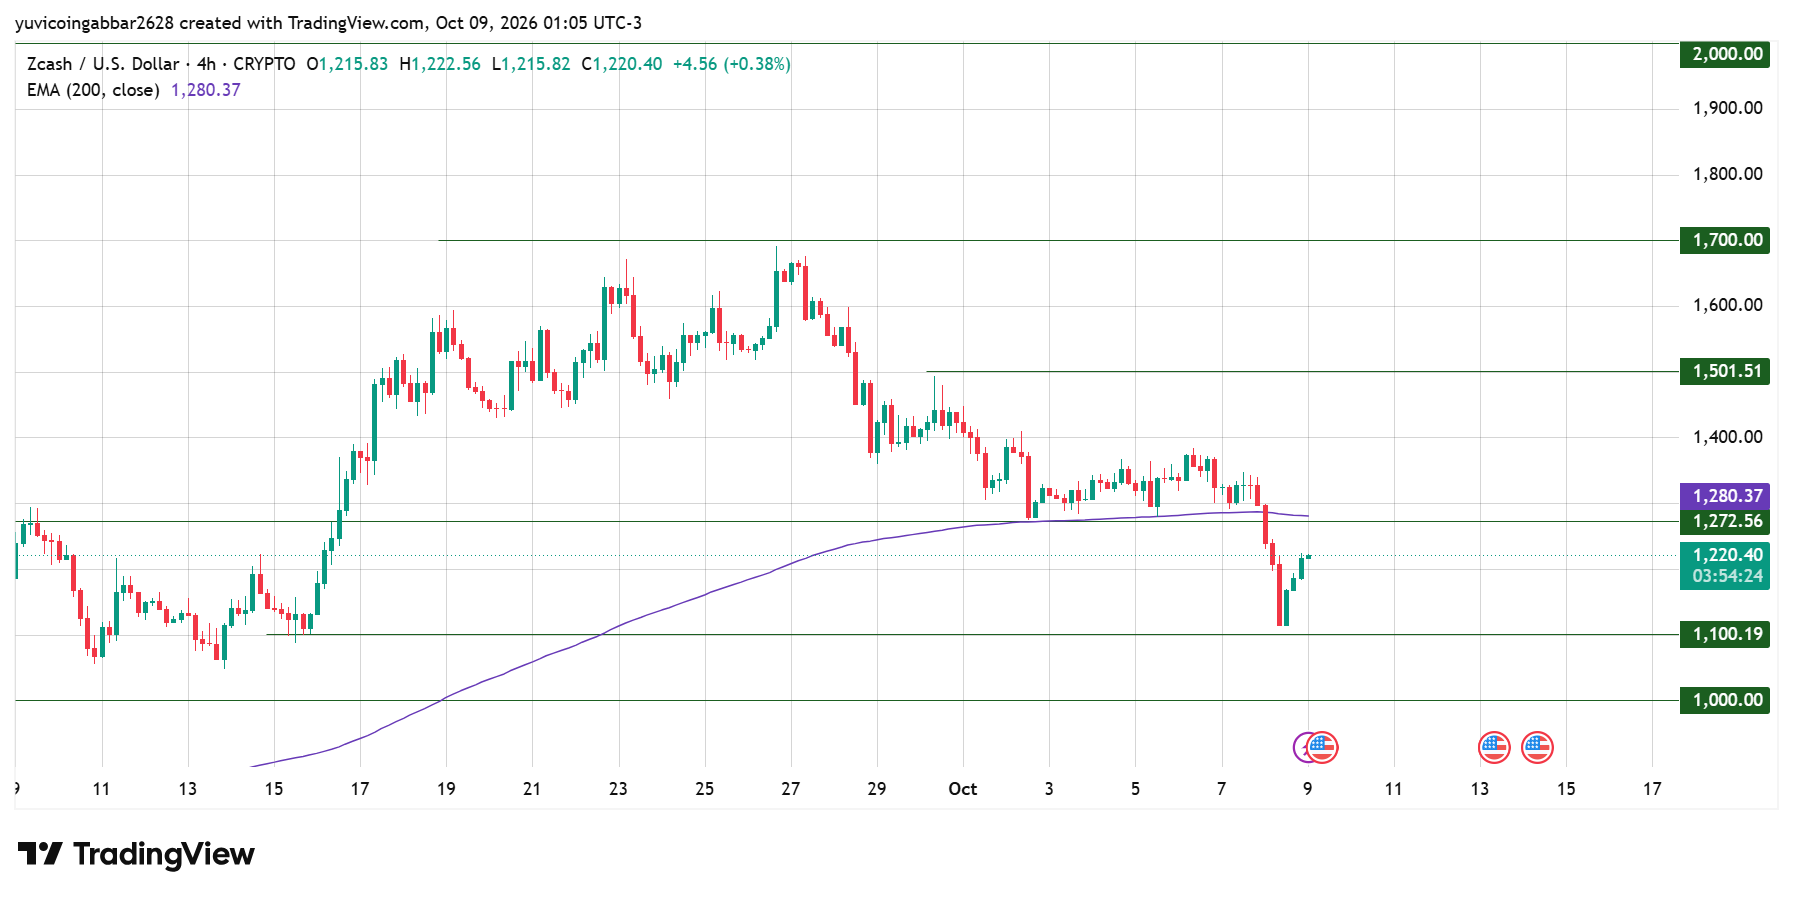
The 200-period EMA, at $1,280.37, sits just above the current price, now acting as resistance after the price fell below it during the decline.
If this bounce continues and ZEC reclaims the EMA, the next resistance levels are $1,272.56, $1,501.51, and then $1,700.00.
A failure to hold above $1,100.19 would suggest the decline hasn't fully run its course, with $1,000.00 as the next level beneath that.
Support
$1,100.19 is the immediate support, close to this week's low. Below that, $1,000.00 marks the next level down.
Resistance
$1,272.56, close to the 200-period EMA at $1,280.37, is the nearest resistance. Clearing it would open the path toward $1,501.51 and further out, $1,700.00.
Zcash Price Forecast: Triggers and Invalidation
Scenario | Trigger | Likely Outcome | Invalidation |
Bounce extends | Hold above $1,100, clear $1,272.56 | Push toward $1,501.51 | Close below $1,100.19 |
Consolidation builds | Range between $1,100 and $1,272 | Base forms before next move | Break below $1,000.00 |
Decline resumes | Close below $1,100.19 | Slide toward $1,000.00 | Reclaim $1,100.19 |
Zcash Price Prediction: Can ZEC Reach $2,000 Again?
It's possible over time if this bounce holds, the EMA resistance near $1,280 is cleared, and the move extends through $1,501.51 and $1,700 after that, but it would take several stages to get there.
The current chart doesn't point to that happening quickly, and a retest of the recent low near $1,100 remains a real possibility if the bounce fails.
Zcash Price Prediction 2026: Expert View
According to CoinGabbar analysts, the "dream entry" framing lines up with what the chart is showing on its own terms: the price has stopped falling for now and is testing resistance just under its 200-period EMA, rather than pushing to new lows.
Whether that turns into the healthy, multi-week consolidation the trader described, or just a brief pause before more downside, likely comes down to whether $1,100.19 holds on the next pullback.
Disclaimer
This article is for informational purposes only and isn't financial advice. Crypto markets are volatile. Always do your own research before making any trading decisions involving ZEC.












.webp)




