Zcash Price Prediction: “Buy the Thesis, Hold It!” Can ZEC Hit $2,000?


Zcash Price Prediction: Can ZEC Hold the $1,000 Support?
The Zcash price today is trading near $1,103.23 after falling 12%. Meanwhile, liquidation data shows that long positions account for most of the reported 24-hour liquidations, raising concerns about near-term selling pressure.
The $1,000 level is the key support to watch, while $1,278.64 is the first major resistance.
This Zcash price prediction depends on whether ZEC can defend the $1,000 zone and recover toward the marked resistance levels.
A support hold could give buyers another opportunity, but a confirmed breakdown would weaken the short-term structure.
Zcash Price Snapshot and Market Activity
Metric | Data |
Latest chart price | $1,103.23 |
Daily change | -12% |
Daily high | $1,153.84 |
Daily low | $1,083.83 |
EMA 200 | $765.84 |
Key support | $1,000 |
The daily chart shows ZEC trading within a descending channel, with price still above the marked $1,000 support.
The EMA 200 is near $765.84, but the price must first overcome nearby resistance levels before a stronger recovery can be assessed.
Why Is Zcash Down Today?
Zcash ($ZEC) is facing selling pressure as its price trades within a descending channel. The supplied liquidation data shows $16.81 million in long liquidations over 24 hours, suggesting leveraged bullish traders faced heavy pressure.
ZEC is near $1,103, with $1,000 support the key level to watch. A confirmed break below it could increase downside risk.
Zcash Forecast: $16.81M in Long Liquidations Raises Pressure
The supplied liquidation data from Coinglass shows that long positions account for most liquidations across the displayed timeframes.
Period | Total Liquidations | Long Liquidations | Short Liquidations |
1 hour | $128.16K | $108.72K | $19.44K |
4 hours | $8.31M | $7.66M | $649.91K |
12 hours | $10.19M | $9.22M | $967.97K |
24 hours | $18.90M | $16.81M | $2.08M |
The $16.81 million in 24-hour-long liquidations suggests that bullish leveraged positions faced substantial pressure in the captured data.
However, liquidation figures alone do not confirm the next price direction. Traders should watch whether ZEC stabilizes near support or continues to make lower lows.
Zcash Price Analysis: Key Support and Resistance Levels
Chart Analysis: ZEC is trading inside a descending channel, with price moving lower as sellers maintain pressure. The $1,000 support level is crucial to watch, while a recovery above $1,278.64 could signal improving momentum.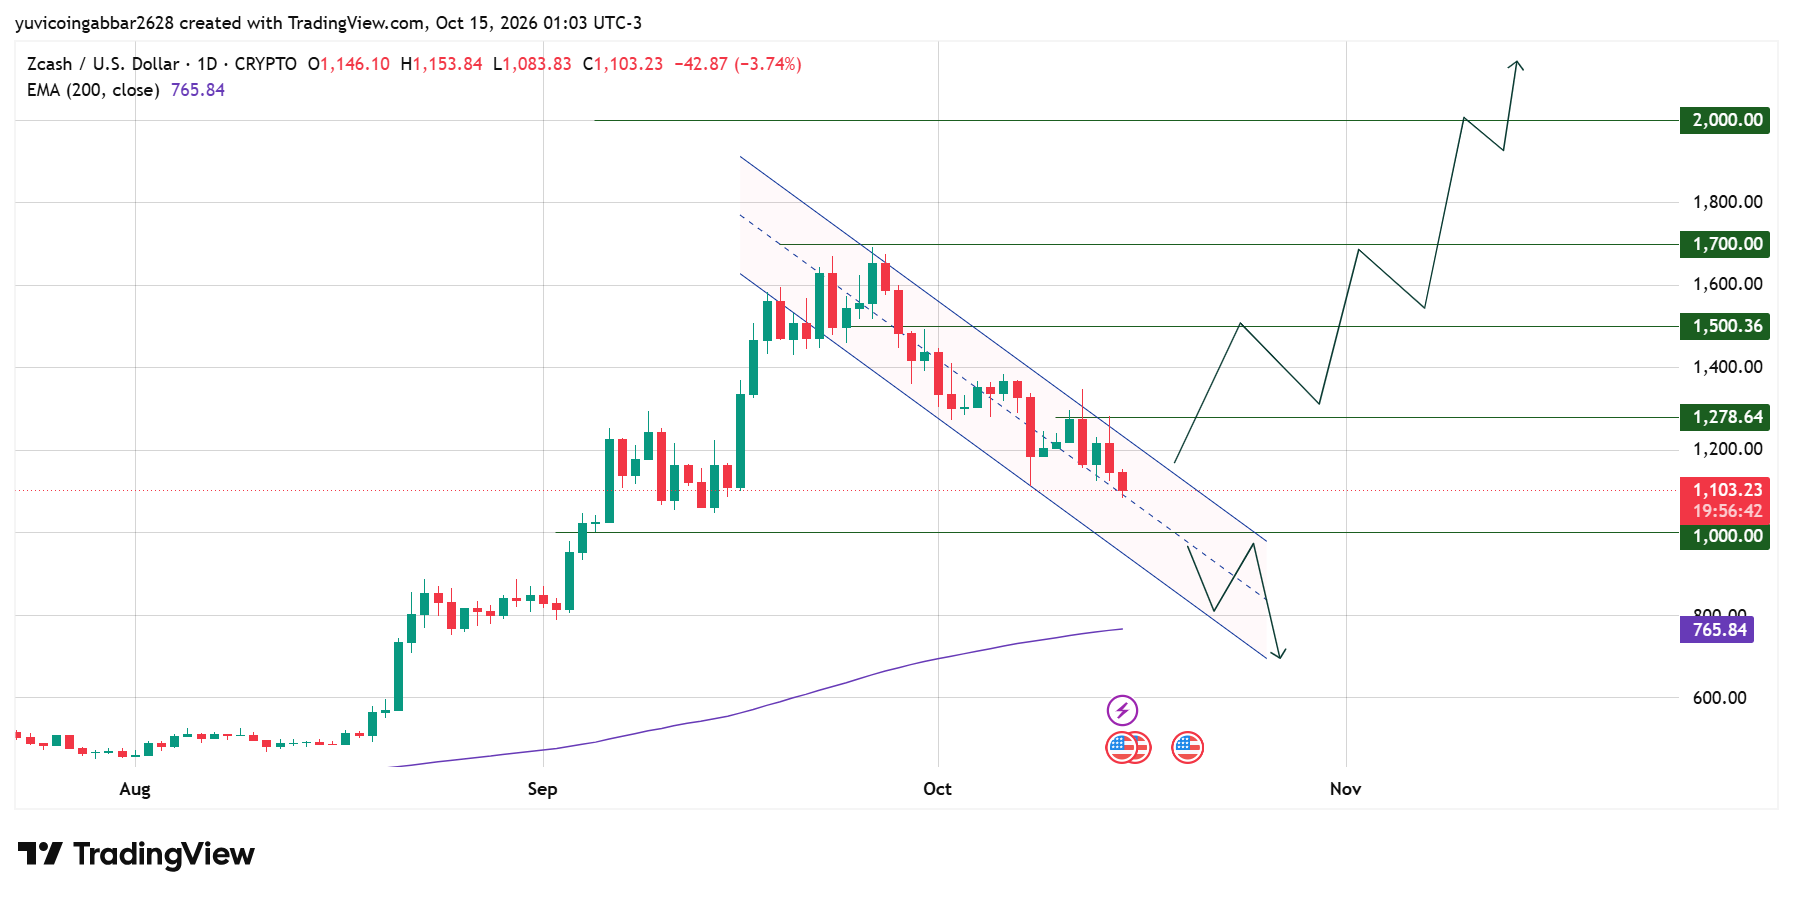
A confirmed breakdown below $1,000 may increase downside risk.
Level | Technical Significance |
$1,000 | Key support |
$1,278.64 | First major resistance |
$1,500.36 | Next upside resistance |
$1,700 | Higher resistance |
$2,000 | Major upside level |
A confirmed break above that resistance could bring $1,500.36 into focus, followed by $1,700.
On the downside, a decisive daily close below $1,000 would weaken the current support structure. Traders should wait for price confirmation rather than treating a brief move above or below a level as a confirmed breakout.
Zcash News: Does NEAR Intents Activity Matter?
A social post claims that more than $2.6 billion in ZEC volume has settled through NEAR Intents, presenting cross-chain activity as a point of interest for the market. 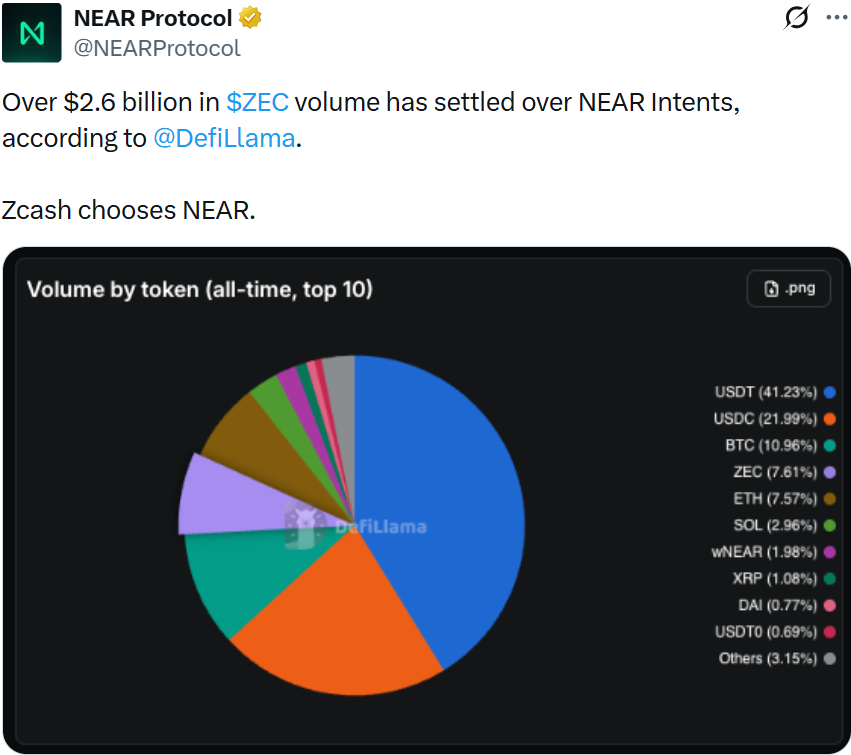
This figure has not been independently verified using the supplied material.
Another post highlights a long-term holding thesis for ZEC, but an individual investor's strategy does not guarantee future price performance.
Market participants should distinguish these narratives from the technical signals visible on the chart.
Source: Data From X
The broader Zcash outlook remains dependent on price action around $1,000 and the ability to reclaim $1,278.64.
Liquidation pressure may contribute to volatility, but the available data do not establish a definitive bullish or bearish outcome.
Zcash Price Prediction 2026: Expert View
According to CoinGabbar analysts, $ZEC is at a technically important level near $1,100, with $1,000 acting as the key downside threshold and $1,278.64 as the first major recovery hurdle.
If buyers defend support and reclaim resistance, higher marked levels could become relevant. If support fails on a confirmed daily close, downside risk may increase.
These ZEC price targets are chart-based reference levels, not guaranteed outcomes. Traders should monitor closing prices, market volatility, and leverage-related risks before drawing conclusions.
Disclaimer
This article is for informational and educational purposes only and does not constitute financial or investment advice. Cryptocurrency markets are volatile, and technical levels are not guaranteed predictions. Always conduct independent research and assess your risk tolerance before making financial decisions.

















