Bitcoin Price Prediction: Will BTC Break $78,804 or Fall Back?


Why did Bitcoin go so quiet right after a sharp drop, and is that calm a setup or a trap?
Volume sank 67.15% in 24 hours, yet buyers still defended $76,325.98, the lower edge of a descending channel.
That defence followed the Binance hack selloff, and any Bitcoin price prediction has to begin with the silence that came after it.
The BTC price today is $77,626 as of 03:40 UTC on Nov 1, 2026. Bulls are targeting $78,804, while bears are watching the floor.
BTC Price Today: Market Snapshot at 03:40 UTC
Metric | Reading |
Price | $77,626.01 |
24H range | $77,000.65 to $77,745.09 |
7D change | -3.86% |
30D change | -8.46% |
Market cap | $1.56T |
24H volume | $11.31B (-67.15%) |
CoinMarketCap data shows 20.1M BTC in circulation against a 21M cap, so supply is nearly fixed.
And a 38.51% gap to the $126,198.07 peak explains why even a green 0.4% day feels thin.
Why Did Bitcoin Volume Collapse by 67.15%?
Selling pressure faded first. Buying interest followed.
Binance's BTC/USDT pair fell 74.69% to $3.67B in volume, according to CoinGlass futures data.
Futures volume of $25.45B dwarfs the $1.81B in spot, so leveraged positions still drive the tape.
Any Bitcoin price prediction built on this tape needs wide error bars, because low volume can resolve in either direction.
Bitcoin Technical Analysis: Falling Channel, Firm Floor
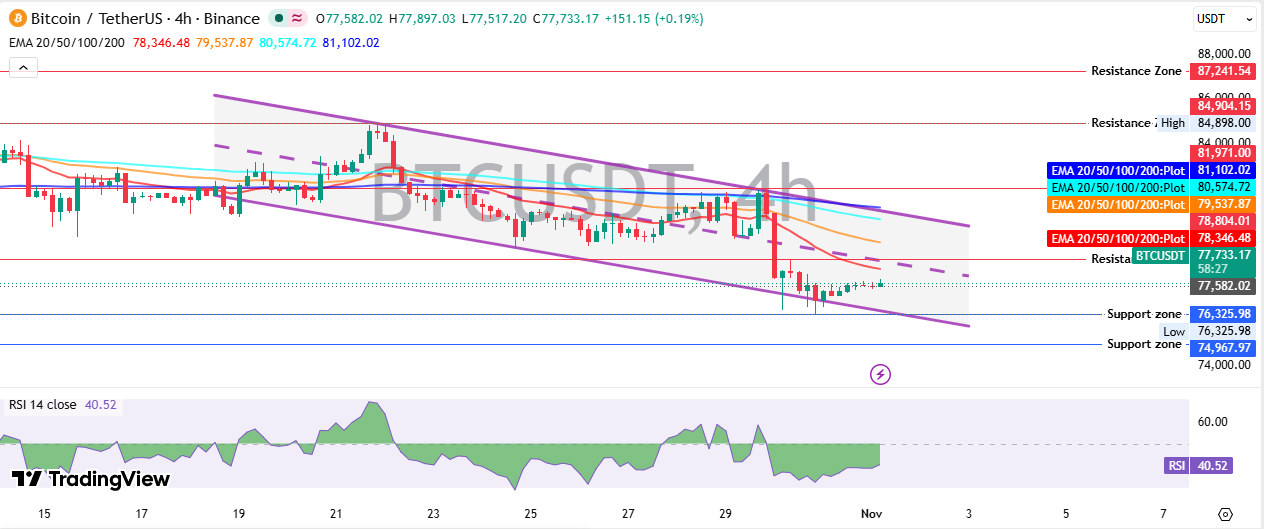
This Bitcoin technical analysis centers on a floor and a ceiling. Price fell sharply on Oct 30, tagged $76,325.98, and has recovered gradually since, now at $77,733.17 on the Binance 4-hour chart.
EMA and RSI Show Who Owns Momentum
An exponential moving average, or EMA, tracks average price with extra weight on recent candles. The 20 EMA sits at $78,346.48, the 50 EMA at $79,537.87, the 100 EMA at $80,574.72 and the 200 EMA at $81,102.02.
That layout, with short lines under long ones, is a classic downtrend signature. Sellers have stacked pressure there since the slide below $84K.
The relative strength index (RSI) is 40.52, sellers hold momentum, though the decline isn't exhausted.
Bitcoin Support and Resistance Levels
Bitcoin support and resistance are clearly defined here. Support sits at $76,325.98, then $74,967.97.
Resistance starts at $78,804.01 and steps up to $81,971.00, $84,904.15 and $87,241.54, a zone just under the earlier $87,400 setup.
Spot sits 1.68% above the floor and 1.52% under the first ceiling. Whether that range holds depends on a single variable, and that's volume.
Short Sellers Took the Hit, Not Longs
Short sellers absorbed the damage. Short liquidations reached $4.27M in 24 hours, against $2.29M for longs.
The amounts are modest, but they aren't meaningless.
In the last 4 hours, $1.67M of shorts were forced out, while longs lost only $240.11K.
Open interest, the total value of open futures bets, sits at $52.79B. Binance accounts run 2.56 longs per short, and OKX shows 2.63. And top traders hold just 1.7067 by position size.
Next to the $263M wipeout covered earlier, today's flush looks small.
ETF Outflows and Fear at 35 Test the Bounce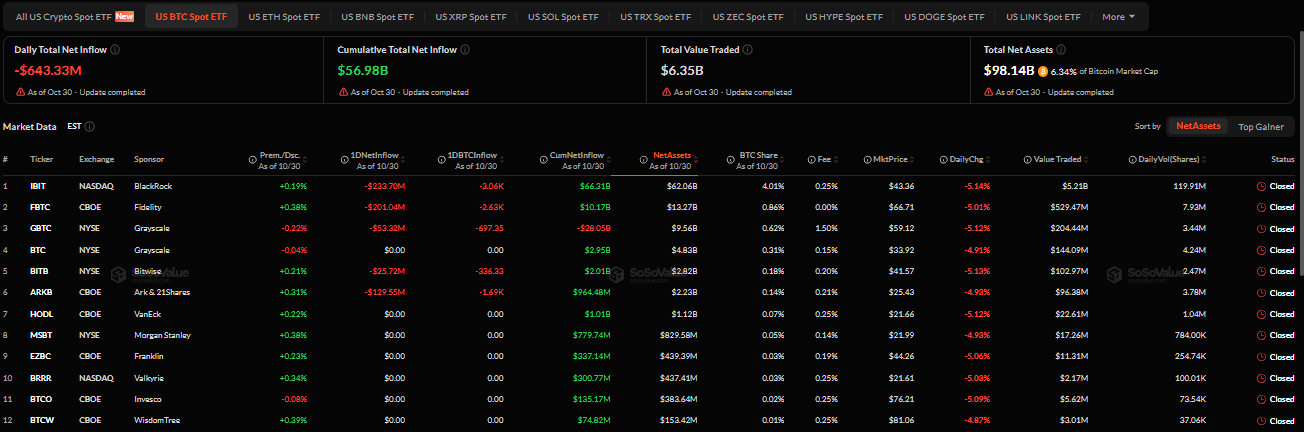
So who is actually buying this dip?
Not the funds. Spot Bitcoin ETF outflows hit 643.33M for the Oct 30 session ending,led by IBIT at-233.70M, FBTC at -201.04M,ARKB at-129.55M and GBTC at -$53.32M.
Cumulative inflows still stand at $56.98B, and net assets hold $98.14B, about 6.34% of BTC's market cap, per SoSoValue ETF flows.
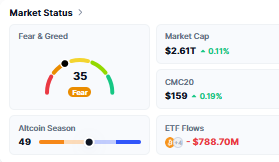
The Fear and Greed Index reads 35, which is fear territory. But fear this deep often marks lows, though never on a fixed schedule.
Halloween Prices and the Whitepaper Anniversary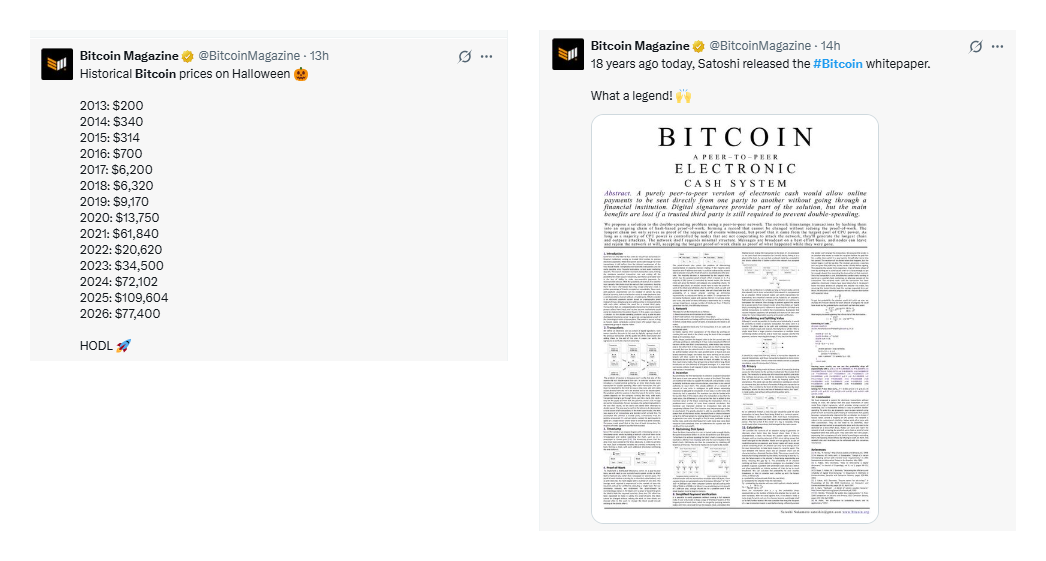
Bitcoin Magazine posted two items on Oct 31, marking 18 years since the whitepaper and listing Halloween prices from 2013 onwards.
That Halloween price list puts 2026 at $77,400, down 29.4% from $109,604 in 2025.
Still, it's 7.3% above 2024's $72,102. Years like 2015 and 2022 also dipped, and the next Halloween print was higher both times.
Bitcoin Price Prediction: Bulls, Base Case and Bears
Bias stays bearish until $78,804.01 flips. Sellers appeared fully in control at first glance, but on closer reading the thin volume shows neither side is pushing hard.
This BTC price forecast covers the next 24 to 72 hours of trading, using levels from the 4-hour chart.
Scenario | Trigger | Target | Invalidation | Liquidity Condition |
Bullish | 4-hour candle trades above $78,804.01 and holds | $81,971.00, then $84,904.15 | Trades back under $76,325.98 | Volume rebuilds, ETF flows turn positive |
Base | Price stays inside $76,325.98 to $78,804.01 | $77,000.65 to $78,346.48 chop | Break of either edge | Thin volume, futures still dominant |
Bearish | Sellers push under $76,325.98 and hold | $74,967.97 | Reclaim of $78,804.01 | Longs forced out, ETF outflows continue |
A stronger Bitcoin price prediction for bulls needs a 4-hour candle above $78,804.01 that holds, and then the path opens. $81,971.00 comes into play, about 5.6% above spot.
Bears need less. A break under $76,325.98 puts $74,967.97 in play, a 3.4% drop from spot.
Traders can compare these ranges with the Black Monday key levels from earlier coverage.
What Breaks the Setup
Whale Supply
CoinMarketCap tracks 1.38M BTC in treasury holdings, and the case of whales selling 30,000 BTC is a reminder of how heavy supply can get.
A thin tape magnifies every large sell order. If whales sell into it, then the price can gap past $76,325.98 before bids refill.
Midterm Event Risk
Politics adds a date traders can't ignore. The 2026 midterm elections are days away, and BTC is already down 11.24% year to date.
Event days can turn a quiet range into a fast one.
Disclaimer: This article is for information only and isn't financial advice. Crypto prices are volatile, and losses are possible. Readers should do their own research and speak with a licensed advisor before making any investment decision.