Gold Crash Below $4,000! Why Are Central Banks Seeing a Bigger Risk?


Gold just slipped under $4,000 again, and one post says it's the first time since late July. Another claims central banks are buying at four times the usual pace. So is this the dip buyers waited for or a warning sign?
This Gold Price Prediction breaks down what the posts say, what the chart shows, and the levels that matter next. Stay till the end.
Gold Prediction: Key Takeaways
Spot XAU/USD is at $3,995.81, about 15% below its August high.
The $3,901.52 level is the one to protect.
XAU/USD must win back $4,000.00 before any recovery looks real.
Gold Price Prediction Today: Market Overview
Metric | Value |
Price | $3,995.81 |
Daily change (vs prior close) | -$28.70 (-0.03%) |
Latest candle range | $3,975.65 to $4,034.09 |
Open | $4,027.50 |
Down from August high | -15.0% |
Gold News: Spot Price Falls Below $4,000
A post from The Kobeissi Letter says spot XAU/USD fell under $4,000 an ounce for the first time since July 29 as US-Iran tensions grew and sits 15% below its August 25 high.
Source: Data From X
Our chart math matches the 15%. Still, it's one post, and it doesn't prove tension alone caused the drop.
Gold Forecast: Central Bank Buying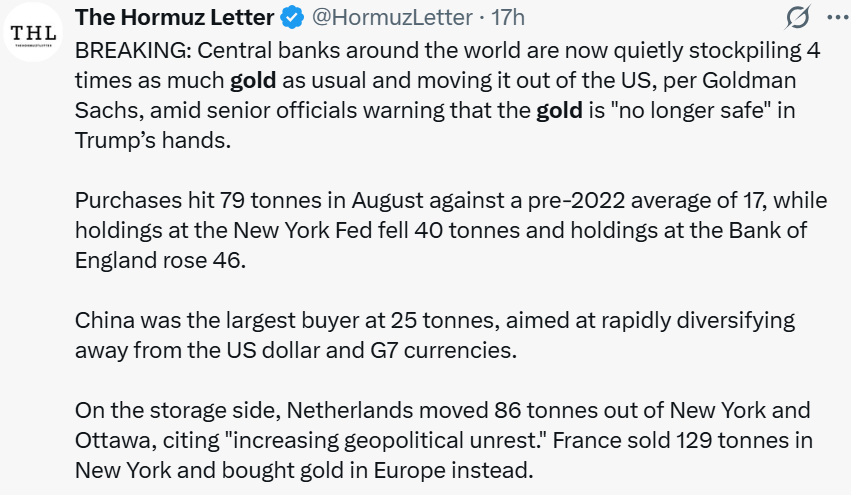
A post from The Hormuz Letter says central banks are buying about four times the usual amount, citing Goldman Sachs. Goldman estimates 79 tonnes were bought in August, against a monthly average of 17 tonnes before 2022, with China at about 25 tonnes.
But World XAU/USD Council data, as reported by ROIC, counted only 39 tonnes, so the real pace is debated. We couldn't confirm the post's claims about it leaving New York vaults. Buying also doesn't guarantee higher prices, since a UBS analyst said higher bond yields can outweigh it short term.
Gold Price Forecast Chart: XAUUSD Technical Analysis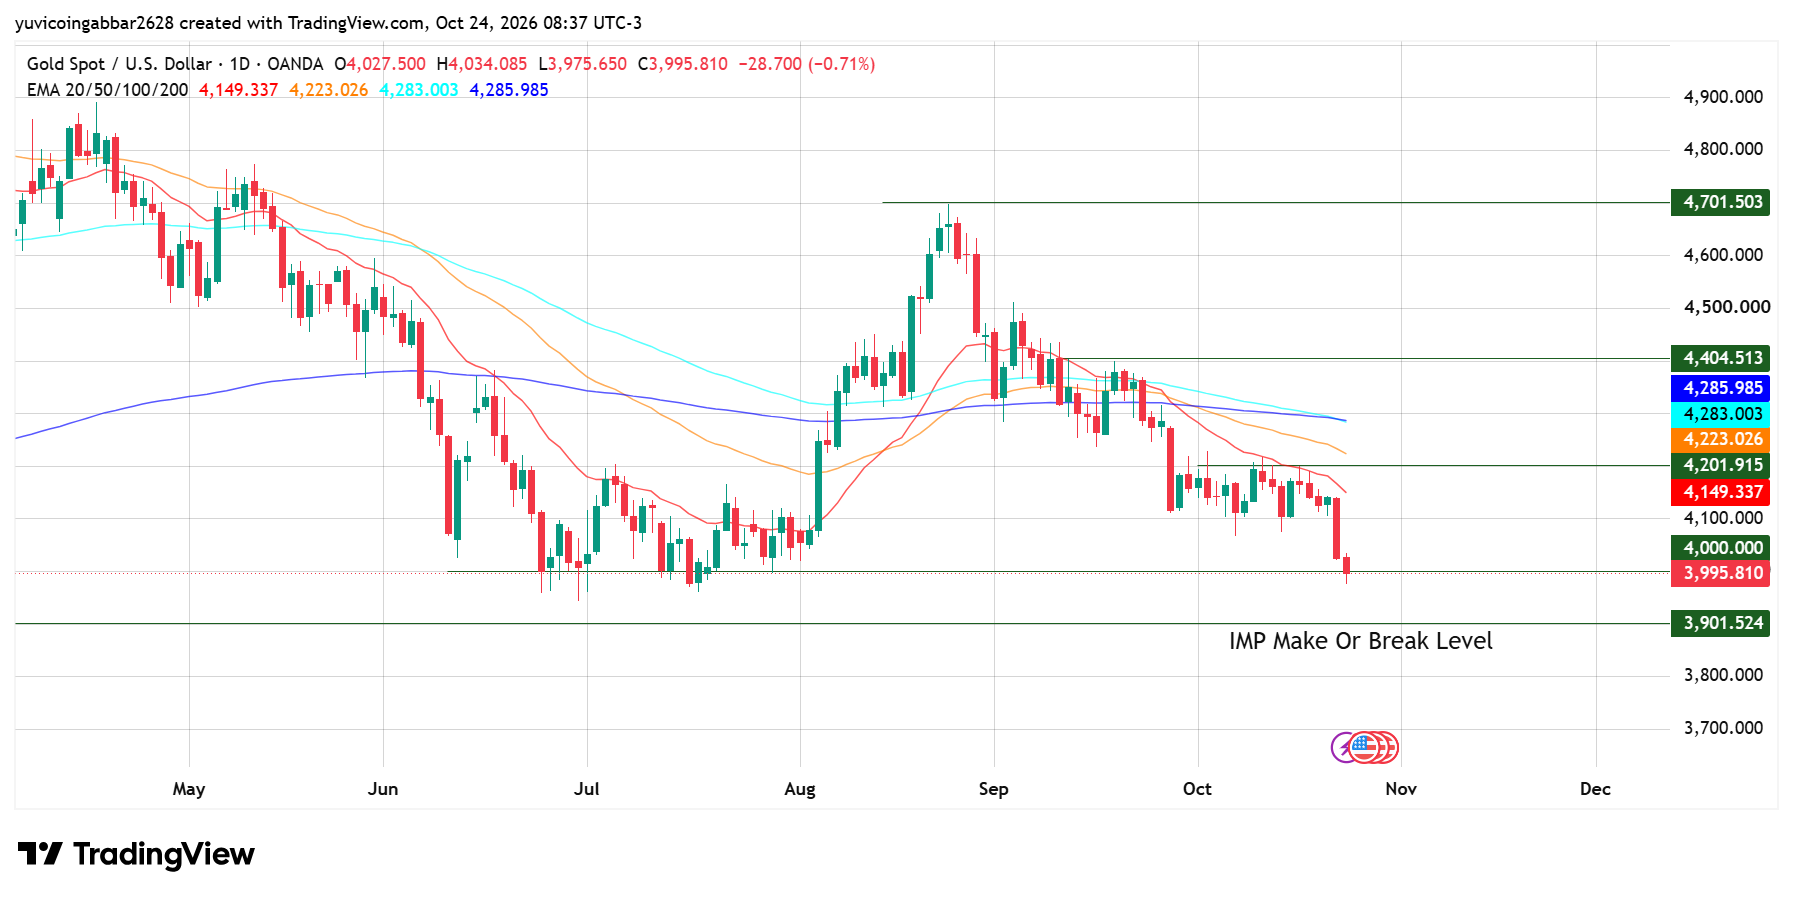
This XAUUSD technical analysis uses the daily chart. XAU/USD peaked near $4,701.50 in August, then slid in steps. It now trades just under $4,000.00 and below all four EMAs. The chart author marks $3,901.52 as the make-or-break level.
Support and Resistance Levels
Type | Level | Note |
Support | $3,901.52 | Make or break level |
Support | $3,975.65 | Low of the latest candle |
Resistance | $4,000.00 | Round number XAU/USD just lost |
Resistance | $4,201.92 | Drawn line near the 50 EMA |
Resistance | $4,404.51 | Drawn line above the EMAs |
Resistance | $4,701.50 | August high |
EMA Levels
EMA | Value |
20 | $4,149.34 |
50 | $4,223.03 |
100 | $4,283.00 |
200 | $4,285.99 |
All four sit above price.
XAU/USD Price Prediction 2026: Bear, Base and Bull Levels
These are levels to watch, not promises.
Case | Level to Watch | How It Was Read |
Bear | Below $3,901.52 | A daily close under the make-or-break level |
Base | $3,901.52 to $4,201.92 | Range from that level to the first drawn resistance |
Bull | $4,404.51 | Needs a break above all four EMAs near $4,283 to $4,286 |
XAU/USD Outlook: Can it Reach $4,701.50?
It's possible, but it takes several steps. $XAU/USD first needs to win back $4,000.00, then clear the 20 EMA at $4,149.34 and the $4,201.92 line. The other EMAs near $4,223 to $4,286 come next, then $4,404.51.
Only then does the August high at $4,701.50 come into play. Nothing on the chart says this happens fast.
XAU/USD Bull Case vs Bear Case
Bull case: Central bank buying holds and $XAU/USD wins back $4,000.00, which puts $4,201.92 in reach.
Bear case: $XAU/USD closes below $3,901.52, and the chart then shows no marked support below.
Gold vs Bitcoin: What the Correlation Post Says
CoinMarketCap shared a post saying Bitcoin's link to $XAU/USD hit an eight-year high in September, while its link to the dollar hit a historic low, per Glassnode. If that holds, weak $XAU/USD matters to crypto traders too.
Source: Data from CoinMarketCap
One month isn't a trend, though. For the crypto side, see our Bitcoin price prediction
XAU/USD Price Prediction: Expert View
XAU/USD sits at a decision point. A hold above $3,901.52 keeps the recovery story alive, and a daily close below it hands control to sellers. Watch $4,000.00 first.
Disclaimer
This article is for general information only and isn't financial advice. prices can move fast, so do your own research and only risk what you can afford to lose.

















