Dash Price Prediction: Will $45.54 Hold After $1.1M Liquidation Wave?


The latest Dash price prediction is rising after a sharp sell-off wiped out about $1.1 million in leveraged positions, mostly longs.
The Dash coin is down 5.0% over the last 24 hours, and traders want to know whether the selling has run its course. DASH now trades near $48.16.
Dash launched in January 2014 as XCoin and became Darkcoin later that year. It took the name Dash in 2015, with a focus on fast digital payments.
According to CoinGecko, Dash price today is $48.16, within a 24-hour range of $45.73 to $52.44. DASH ranks 94th by market capitalization at about $618.628 million.
Live Dash Market Data
Metric | Value |
DASH Price | $48.16 |
24h Change | -5.0% |
24h Range | $45.73 to $52.44 |
Market Cap | $618.628M |
Source: CoinGecko, as of October 30, 2026.
Dash Liquidation Data
Timeframe | Total Liquidated | Longs | Shorts |
1 hour | $7.69K | $4.08K | $3.61K |
4 hours | $10.40K | $4.78K | $5.62K |
12 hours | $966.49K | $942.57K | $23.92K |
24 hours | $1.10M | $1.03M | $69.73K |
Source: Liquidation Data Taken From CoinGlass, as of October 30, 2026.
Longs took almost all of the damage. About 97.5% of the $966.49K liquidated over 12 hours came from long positions, and the 24-hour share is near 94%.
That pattern fits the sharp red candle on October 29, when forced selling pushed the price lower.
The last four hours look much calmer, with only $10.40K liquidated and a roughly even split.
Quiet liquidation data suggests the forced selling has eased, although it does not prove that price has bottomed.
Dash Exchange Volume
Binance leads DASH trading at $55.33 million over 24 hours, roughly double LBank at $26.59 million. MEXC follows closely at $25.83 million.
OKX adds $17.31 million and Bybit $12.88 million, while WhiteBIT, BingX, and Kraken report smaller amounts.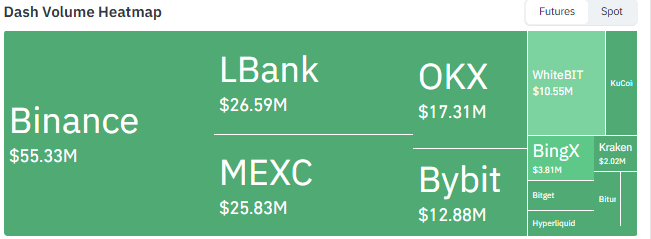
Source: Volume Heatmap Data Taken From CoinGlass, as of October 30, 2026.
Volume is spread across many venues, with no single exchange setting price alone.
A rebound that holds on Binance volume would carry more weight than one seen only on smaller exchanges.
Dash Technical Analysis
This Dash price prediction October 2026 reads the daily DASH/USDT chart on Binance.
Price moves inside a falling wedge that formed after DASH peaked near $78 in early September. The current price sits roughly 39% below that high.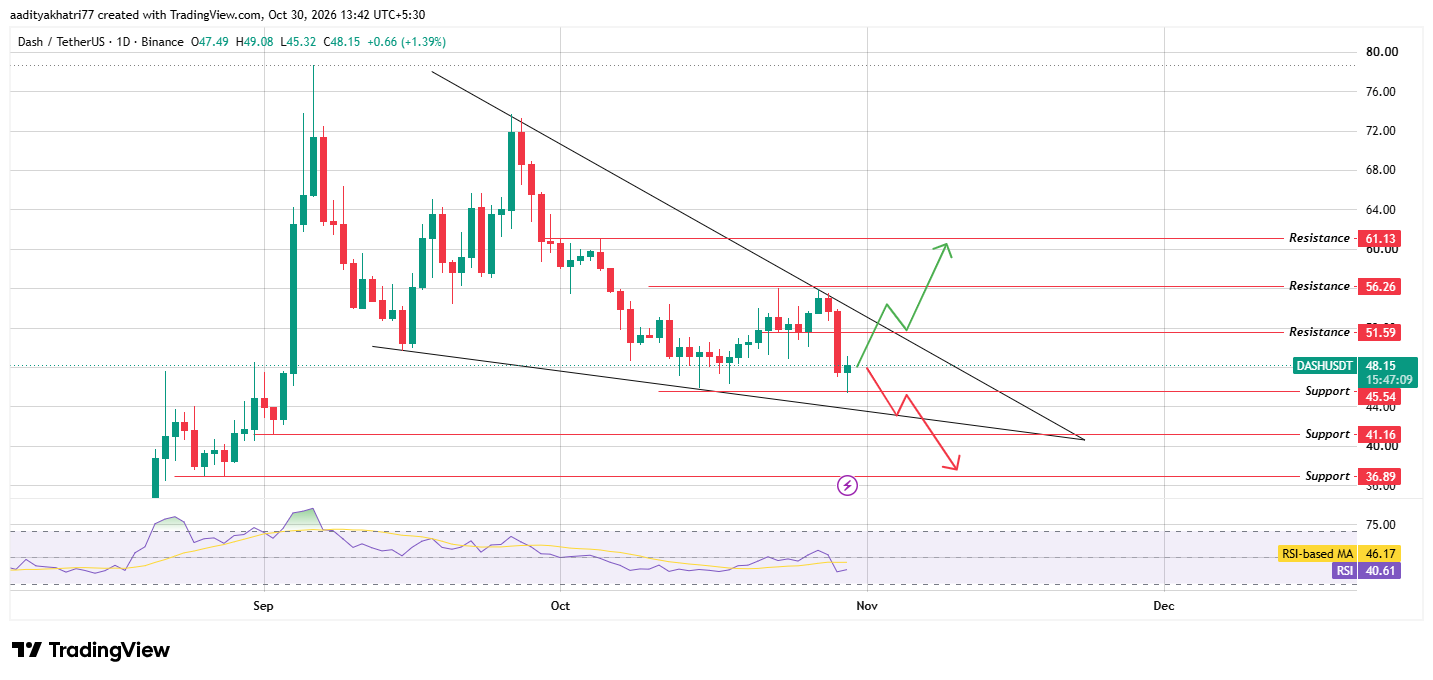
Source: TradingView, DASH/USDT 1D, Binance, as of October 30, 2026.
Both trendlines slope down, and they are converging. The upper trendline now runs near $54 and the lower one near $44, so the range keeps narrowing. A large red candle on October 29 closed near $47.5.
The current candle opened at $47.49, dipped to $45.32, and trades near $48.15, a gain of 1.39%. The dip reached the $45.54 support, and buyers pushed the price back above it.
The RSI reads 40.61 against its average of 46.17, which shows weak momentum above the 30 oversold line.
Can DASH Bounce and Break the Falling Wedge Trendline?
The bullish case starts with a hold. DASH needs to keep $45.54 intact, since the dip today closed back above it.
The next step is a daily close above $51.59 with volume over the 20-day average. After that, price must also close above the upper wedge trendline, which runs near $54 on the chart.
Both closes should carry strong volume, because the last rally stopped below this trendline.
A confirmed break would open $56.26 first and then $61.13. A falling wedge often resolves upward, yet it can also fail, so confirmation matters.
What Happens If DASH Loses Support?
The bearish case begins with a rejection below $51.59 or a slide back toward $45.54.
A daily close under $45.54 on selling volume above the 20-day average would show that the rebound has failed.
The lower wedge trendline near $44 offers little cushion. If the price closes below it, the next supports are $41.16 and $36.89, which match earlier swing lows on the chart.
A brief wick under support is not enough. If the price closes back above $45.54 within a day or two, the move may prove a false break.
Price Levels to Watch
Support | Resistance |
$45.54 | $51.59 |
$41.16 | $56.26 |
$36.89 | $61.13 |
Bull, Base, and Bear Scenarios for Dash Price Prediction
Scenario | Setup | Level |
Bull | $DASH holds $45.54, then a daily candle closes above $51.59 and the upper wedge trendline with volume over the 20-day average. | $56.26 first, then $61.13 |
Base | $DASH keeps moving inside the wedge with no daily close beyond $45.54 or $51.59. | Between $45.54 and $51.59 |
Bear | Sellers cap price is below $51.59, and a daily candle closes under $45.54 and the lower trendline while volume runs above the 20-day average. | $41.16 first, then $36.89 |
Dash vs Bitcoin
Any Dash price prediction outlook should check how DASH trades against Bitcoin. Over the last 24 hours, DASH is down 5.0% in dollars and down 2.6% against Bitcoin.
Together, those figures imply that Bitcoin lost about 2.5% in dollar terms. DASH therefore fell about twice as much as Bitcoin.
The weakness is partly market-wide and partly specific to the long liquidations.
Methodology
This Dash price prediction draws on four inputs. Market data comes from CoinGecko and was taken on October 30, 2026.
The chart is a daily DASH/USDT view from Binance in TradingView, with timestamps in UTC+5:30.
Liquidation and exchange volume figures come from CoinGlass screenshots taken the same day.
Support and resistance levels were read directly from the chart. The wedge trendlines carry no labels, so the $54 and $44 readings are approximate.
The distance of about 39% from the September high uses a chart reading near $78.
CoinGecko combines prices from many exchanges, so its 24-hour range differs slightly from the Binance candles.
No news item was reviewed, since none was supplied, and moving averages were not part of the chart. The scenarios carry no assigned probabilities.
Expert Opinion
As general market commentary, a liquidation wave that is almost entirely long positions often marks forced selling.
Price can steady once those positions clear, yet the pattern does not guarantee a bottom.
The $45.54 level matters most here, since it held on the latest dip. A daily close above $51.59 on rising volume would show that buyers are returning. A close below $45.54 would suggest that sellers still control the move.
Disclaimer: This article is for information only and is not financial advice. DASH is volatile, and the price can fall below $36.89 if support fails and broader market conditions weaken. No scenario here carries a stated probability, and a confirmed breakout can still reverse. Readers should do their own research and size any position to a loss they can accept.