Gold Price Prediction: Can China's Dip-Buyers Hold $4,000 at FOMC?


Gold is trading just above $4,000 hours before the Federal Reserve's rate decision, while a post says Chinese buyers are adding on to the dip. Can that demand hold $4,000 through FOMC? It may help, but the Fed matters more. This Gold Price Prediction covers the China demand claim, FOMC and a chart read.
Market data checked on October 28, 2026, at 14:52 IST, before the Fed decision.
Gold Price Prediction Today: Market Overview
Metric | Value |
Price | $4,029.14 |
Daily Candle Change | -0.27% |
Candle Range | $4,028.23 – $4,070.77 |
Gold Price Outlook: A $600 Billion Claim
A post on X says $600 billion was added to gold and silver in the last 7 hours. It gives no source, and today's candle is down 0.27%, so CoinGabbar could not verify it.
GOLD Update: China Treasury and Gold Claim
A viral X post says China’s stocks crashed over 40%, that China is dumping more than $100 billion of U.S. Treasuries, and that its gold reserves hit a record $325 billion. CoinGabbar could not verify the 40% crash, the $100 billion sale, or the “largest since 2007” line.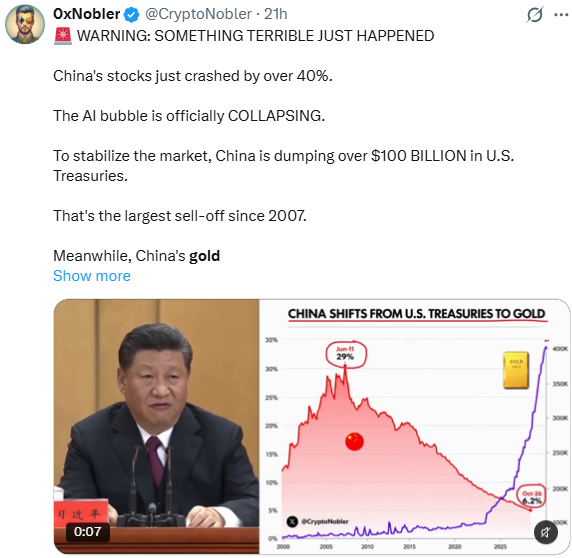
What does check out is that China’s Treasury holdings fell to an 18-year low of $618 billion in July 2026, and its central bank has now bought gold for 23 months in a row. Also, Hong Kong began a trial of its gold clearing system on July 7, 2026.
Traders may read this as a push away from the dollar, but it is not a direct trigger for crypto prices.
Trading in the Shanghai Gold Exchange's Au99.99 contract hit 43 million lots last week, about 430 tons, the highest since April. The post adds that purchases through gold accumulation plans, which let people buy small amounts over time, passed the full-year 2025 total in the first nine months of 2026.
Source: Data From X
CoinGabbar could not verify these figures.
FOMC Update: What the Fed Decides Today
The FOMC, the Fed's rate-setting committee, meets on October 27 and 28. The statement is due at 2 pm Eastern, about 11:30 pm IST.
The rate is 3.75%–4.00% after September's quarter-point hike. FinanceFeeds cites CME FedWatch odds of 92.8% for a hold, 6.6% for a hike today and 84.4% for a hike in December. official Federal Reserve calendar
How FOMC Could Move Gold: Rate Up vs Rate Down
Gold pays no interest. When rates and Treasury yields rise, holding gold costs more in lost income, and a stronger dollar makes it dearer for foreign buyers, so gold often falls. When rates fall, the reverse tends to help gold.
Fed outcome | Likely effect on gold | Chart levels to watch |
Rate hike (6.6%) | Pressure | $4,000, then $3,900 |
Hold, hawkish on December | Pressure | $4,000, then $3,900 |
Hold, softer tone | Support | $4,119.785, then $4,200 |
Rate cut (not priced) | Strongest lift | $4,200, then $4,400 |
These are reference levels, not forecasts.
Gold Price Prediction: Chart Analysis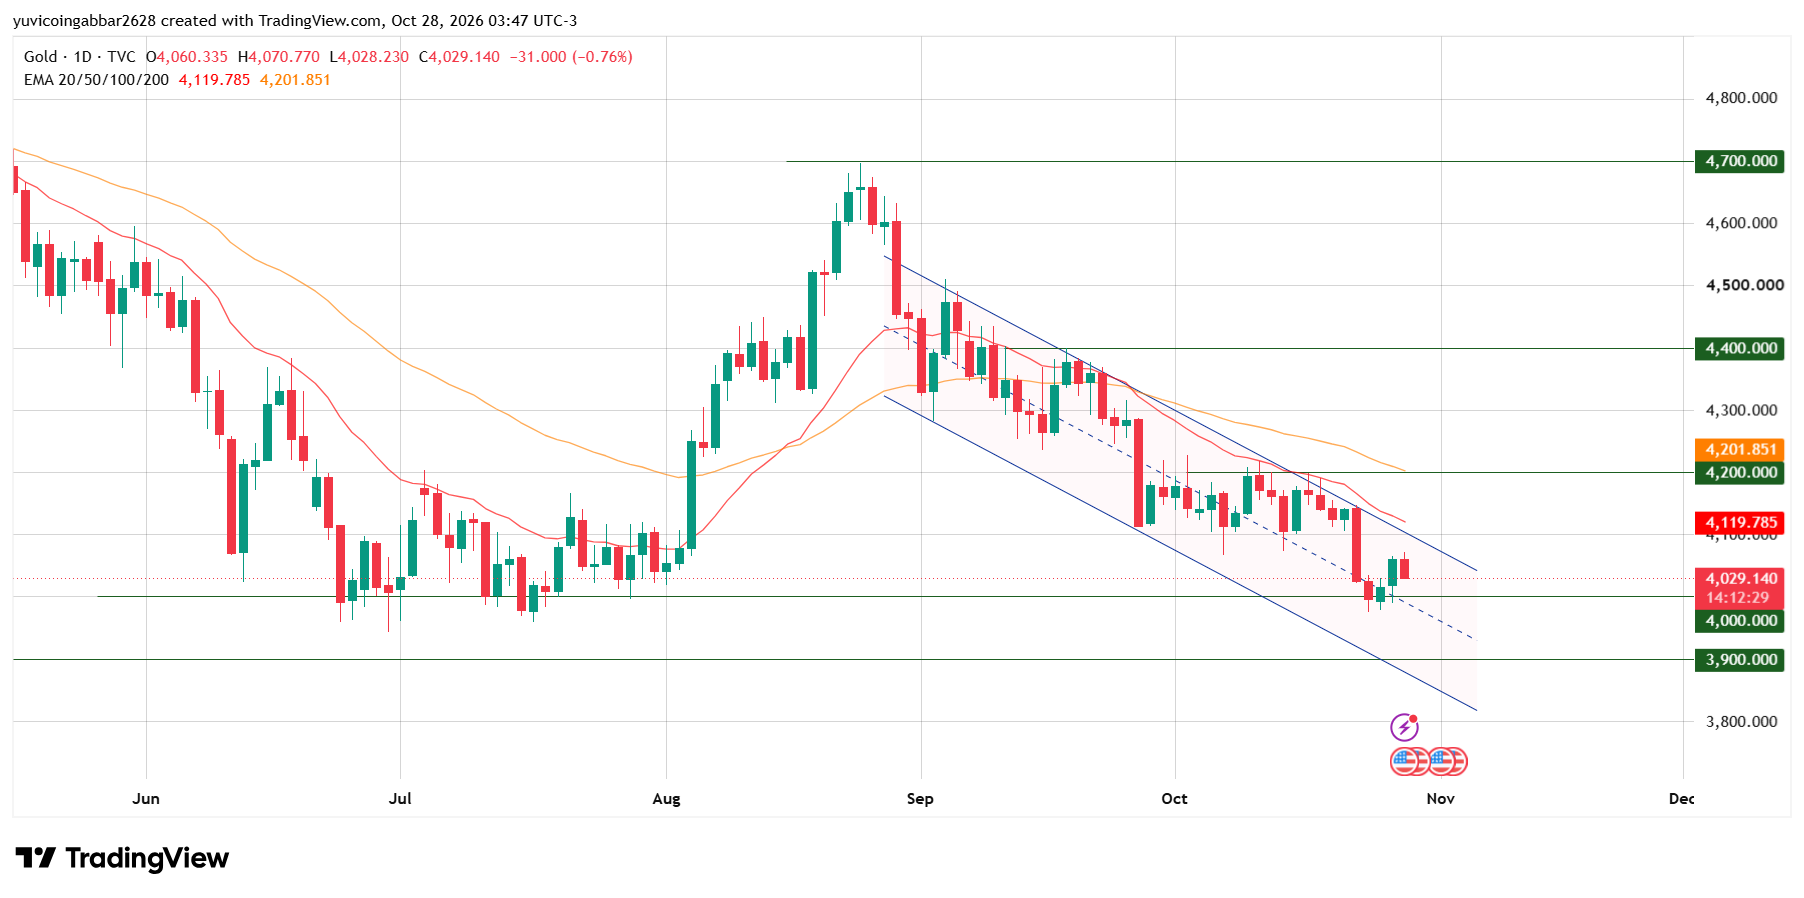
Gold peaked near $4,700 in late August, then fell inside a falling channel, a pair of downward-sloping boundaries. Rallies stalled at $4,200 several times in October. On October 23, gold dipped to about $3,975, its first move under $4,000 since July.
Price is about 2.2% under the 20 EMA $4,119.785 and 4.3% under the 50 EMA $4,201.851, and the 20 EMA sits below the 50 EMA, a bearish order.
Gold Forecast: Support and Resistance Levels
Type | Level |
Highest marked level | $4,700.000 |
Resistance 3 | $4,400.000 |
Resistance 2 | $4,200.000 |
Immediate support | $4,000.000 |
Deeper support | $3,900.000 |
Bull case: A daily close above the 20 EMA at $4,119.785 and then $4,200 would put the 50 EMA at $4,201.851 in play.
Bear case: If XAU/USD closes below $4,000, the price could slide about 3% toward $3,900.
Gold Scenarios and Invalidation (October 28, 2026)
Scenario | Trigger | Likely Outcome | Invalidation |
Bull | Close above $4,200 | Move toward $4,400 | Close below $4,000 |
Base | Range of $4,000 to $4,119.785 | Sideways near $4,000 | Break of either level |
Bear | Close below $4,000 | Slide toward $3,900 | Close back above $4,000 |
XAU/USD Prediction: Can Gold Reach $4,400?
It would take a gain of about 9% from $4,029.14. Any gold forecast toward that level needs more than dip-buying.
Gold Price Prediction 2026: Expert View
The Fed decision will likely matter more than China's demand. A hold is priced in, so a firm tone on a December hike could lift yields and the dollar and pressure XAU/USD toward $4,000. A softer tone could help XAU/USD test the 20 EMA.
The level to watch is $4,000. A daily close below it would open $3,900, while a close above $4,200 would be the first real sign of strength.
Disclaimer
This article is for informational purposes only and isn't financial advice. Markets are volatile. Always do your own research before making any trading decisions involving gold.



















