Cardano Price Prediction: Will CIP-113 Push ADA $0.2125?


Will the next Cardano headline finally move ADA, or will the chart shrug it off?
This Cardano price prediction starts with a calendar, because regulated-asset talks and a developer session land 25 hours apart. ADA price today hasn't picked a side, and the monthly Cardano outlook frames the wider range.
ADA Price Today: CoinMarketCap Snapshot
ADA trades at $0.2066 at 09:30 UTC on October 28, 2026, up 1.4% in 24 hours. The daily range runs from $0.2011 to $0.2078.
Market cap is $7.6B, with fully diluted value (the cap if all 45B ADA circulated) at $9.29B, per CoinMarketCap data. Volume slipped 7.04% to $193.4M. And that's only 2.54% of market cap changing hands.
Cardano Price Forecast: Futures Set the Pace
Futures volume reads $338.99M against $34.43M in spot, about 9.8 times more. ADA open interest, the value of live futures contracts, rose to $472.95M from $427.92M at 06:00 UTC on October 27, 2026.
Binance's long/short account ratio is 1.896 on CoinGlass derivatives data, and OKX shows 2.67. A reading above 1 means longs outnumber shorts, and $200.21K of the $257.36K liquidated in 24 hours was long.
Cardano On-Chain Data: Staking Is Deep, Usage Is Thin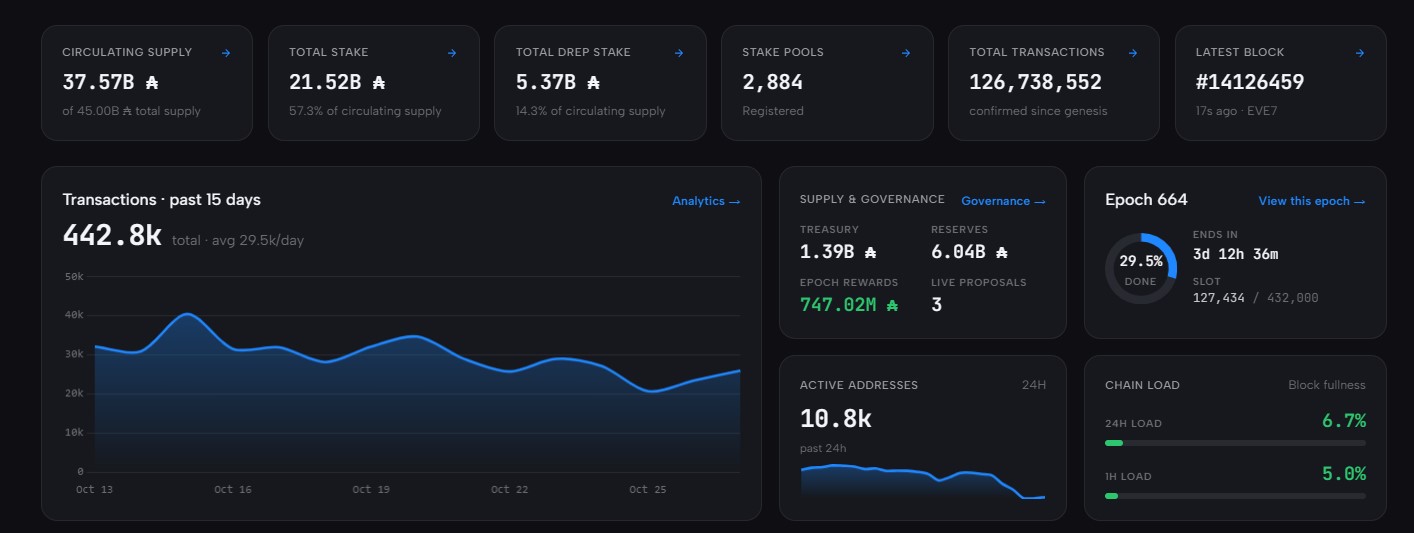
Cardanoscan lists 21.52B ADA staked, 57.3% of the 37.57B circulating supply, spread across 2,884 pools.
But usage is thin. Daily transactions slid from a peak near 40K to roughly 21K before recovering toward 26K, and active addresses sit at 10.8K on Cardanoscan network stats.
Governance Check: DReps and Live Proposals
DReps, the delegated voters in Cardano governance, hold 5.37B ADA, or 14.3% of circulating supply. Live proposals total 3, and the treasury holds 1.39B ADA.
At 14.3%, DRep weight is still small next to the supply, so governance headlines rarely move price alone. Past coverage of the midline governance vote adds context.
Cardano CIP-113 Catalyst: Two Dates Traders Marked
Roundtable on Regulated Assets
Event alert. Cardano hosts a roundtable on Thursday, October 29, 2026, at 10:00 UTC. The topic is programmable tokens under CIP-113 and regulated assets.
Speakers come from Encryptus Global (USDA), Brale, Deploi Inc., and the Cardano Foundation, per the roundtable announcement.
Developer Office Hours #85
Friday, October 30, 2026, at 15:00 UTC brings Developer Office Hours #85. Giovanni Gargiulo walks through Cardano CIP-113 and how developers can start building.
And tokens need apps before they need traders. The developer session post carries the registration page.
Narrative Versus Volume: Can Buyers Show Up?
Can a roundtable really move a $7.6B coin? Spot volume sits at $34.43M a day.
That reads bearish. Actually, scratch that. The 90-day gain of 27.70% on CoinGlass shows buyers have turned up before, even with the 30-day drop at 19.03%.
Regulated assets also need institutional rails, and the earlier Fireblocks news coverage adds background on that side.
Cardano Technical Analysis: ADA Presses the Channel Roof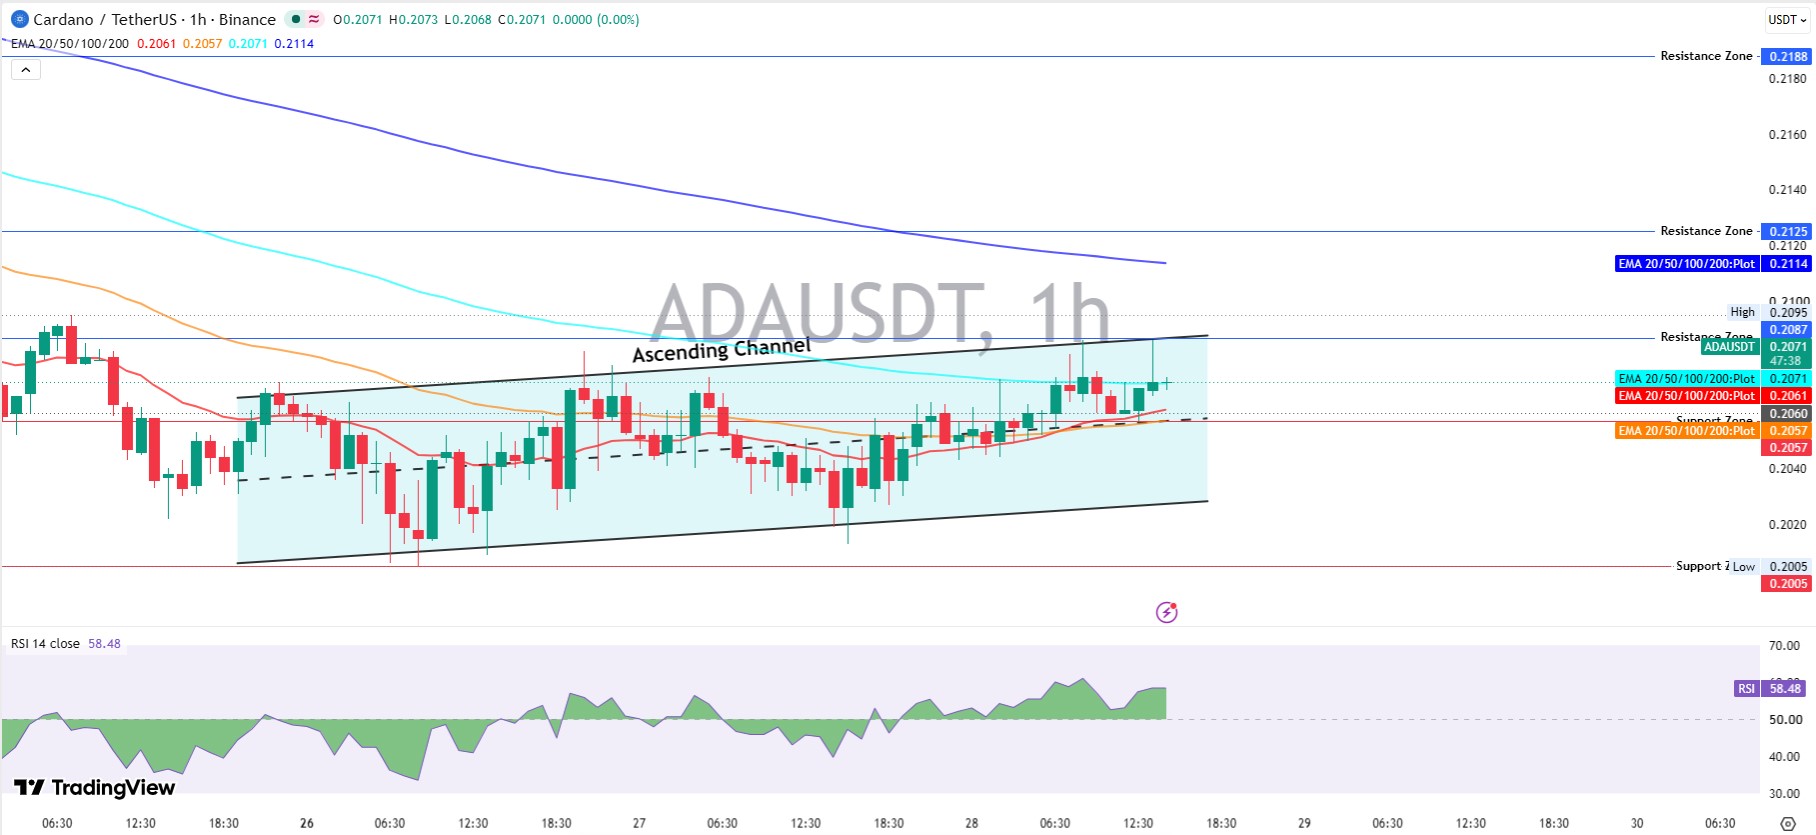
The 1-hour Binance chart shows ADA at $0.2071, pinned to the 100 EMA. EMA means exponential moving average, a line that weights recent prices more.
The 20 EMA and 50 EMA sit at $0.2061 and $0.2057, while the 200 EMA stands at $0.2114. RSI, a 0 to 100 momentum gauge, reads 58.48 on the TradingView ADAUSDT chart.
Ascending Channel Still Intact
Price has climbed inside an ascending channel, a rising lane between two trendlines, since the $0.2005 low. The roof sits near $0.2087, and the short-term bias is bullish while $0.2057 holds.
The earlier ascending channel analysis tracked a similar structure.
Key Support Levels
Buyers have defended $0.2060 and the 50 EMA at $0.2057 across the past 3 days. Under that, the lower rail near $0.2032 and the $0.2005 low form the deeper floor.
That rail matches the level in the previous channel floor article.
Key Resistance Levels
Sellers wait at $0.2087, then the $0.2095 swing high. The 200 EMA at $0.2114 follows, and $0.2125 and $0.2188 mark the outer resistance zones.
But $0.2114 is the real wall, and the 200 EMA resistance article covers that average in detail.
Cardano Price Prediction Scenarios for the Next 7 Days
Bullish Scenario
Bulls want a breakout, and a breakout needs something. Spot volume above $34.43M a day, plus a 1-hour trade above $0.2087.
Holding the 100 EMA, the story in the 100 EMA reclaim article keeps $0.2114 and $0.2125 in range.
Base Scenario
A chop between $0.2060 and $0.2087 is likeliest while volume stays near $193.4M.
Bearish Scenario
If $0.2057 breaks, buyers lose the 50 EMA, and then. $0.2032 comes into play, followed by $0.2005, with long liquidations speeding the slide as in the earlier long flush analysis.
Scenario Table
Levels come from the 1-hour Binance chart at 9:30 UTC on October 28, 2026.
Scenario | Trigger | Target | Invalidation | Liquidity Condition |
Bull | 1-hour trade above $0.2087 | $0.2114, then $0.2125 | Back under $0.2060 | Spot volume rises above $34.43M a day |
Base | $0.2060 holds, $0.2087 caps | $0.2060 to $0.2087 range | Trade outside the range | Volume stays near $193.4M |
Bear | 1-hour trade under $0.2057 | $0.2032, then $0.2005 | Back above $0.2071 | Long liquidations stay above $200K a day |
Risks That Could Change the Cardano Price Prediction
Bitcoin is the biggest outside risk. It trades at $81,421.16, up 2.25%, but BTC volume fell 14.23% to $21.92B, so that rally lacks fuel.
Futures add another, running near 10 times spot volume, so a flush only needs. A nudge.
Disclaimer: This article is for information only and isn't financial advice. Crypto prices swing hard, and no forecast is guaranteed. Readers should do their own research before trading.



















