Shiba Inu Price Prediction: Who Really Holds 41% of SHIB Supply?

One wallet holds more than 40% of a famous dog-themed meme coin's entire supply. It can't sell a single token.
So who really moves the price?
Meanwhile, the chart keeps pressing into a ceiling, and that earlier channel rejection still hangs over every bounce.
SHIB Price Today: Market Snapshot
Market data was checked on October 23, 2026, at 11:00 UTC. This Shiba Inu price prediction starts with CoinMarketCap data before any chart talk.
Metric | Value |
Price | $0.000005065 |
24H change | +1.22% |
Market cap | $2.98B |
24H volume | $45.92M |
Volume to market cap | 1.52% |
Circulating supply | 589.23T SHIB |
SHIB price today sits at $0.000005065, up 1.22% on the day. But volume fell 7.64% to $45.92M, which is thin for a $2.98B coin.
Rising price on falling volume rarely signals conviction.
Why Is SHIB Moving Today?
Small bounce. SHIB gained 1.22% in 24 hours, swinging between $0.000004914 and $0.000005104. The 7-day change still reads -1.01%. The 30-day drag is -17.07%.
Sentiment across the meme coin market is doing the steering. Dip buyers stepped in. That's all.
SHIB Whale Concentration: What Etherscan Shows
Etherscan holder data shows a lopsided map. A null address holds 41.04% of the max total supply, worth about $2.08B.
Whales, just 793 wallets, control 94.68% of market value in the tier table. The top 100 holders own 82.83%.
And the Gini score reads 0.9959. Gini measures how unevenly tokens are spread, and 1.0 means one holder owns everything.
That null wallet isn't selling pressure. It's dead weight that shrinks the real float.
Real risk sits with exchange wallets and whales. Robinhood holds 3.93%, and Binance 28 holds 3.76%.
Etherscan counts 1,698,973 holders, while CoinMarketCap shows 3.1M, so the two counts don't match.
SHIB Open Interest and Futures Data
CoinGlass futures data shows $32.13M in futures volume against $11.08M in spot. That's nearly three times more.
SHIB open interest, the total value of live futures contracts, stands at $52.49M. OKX's long/short ratio reads 2.8, so longs crowd the book.
Liquidations over 24 hours total $38.21K, split $18.88K longs and $19.34K shorts. Pain was even.
But why would longs crowd in under a falling ceiling? Crowded trades rarely warn first.
SHIB Technical Analysis: Descending Channel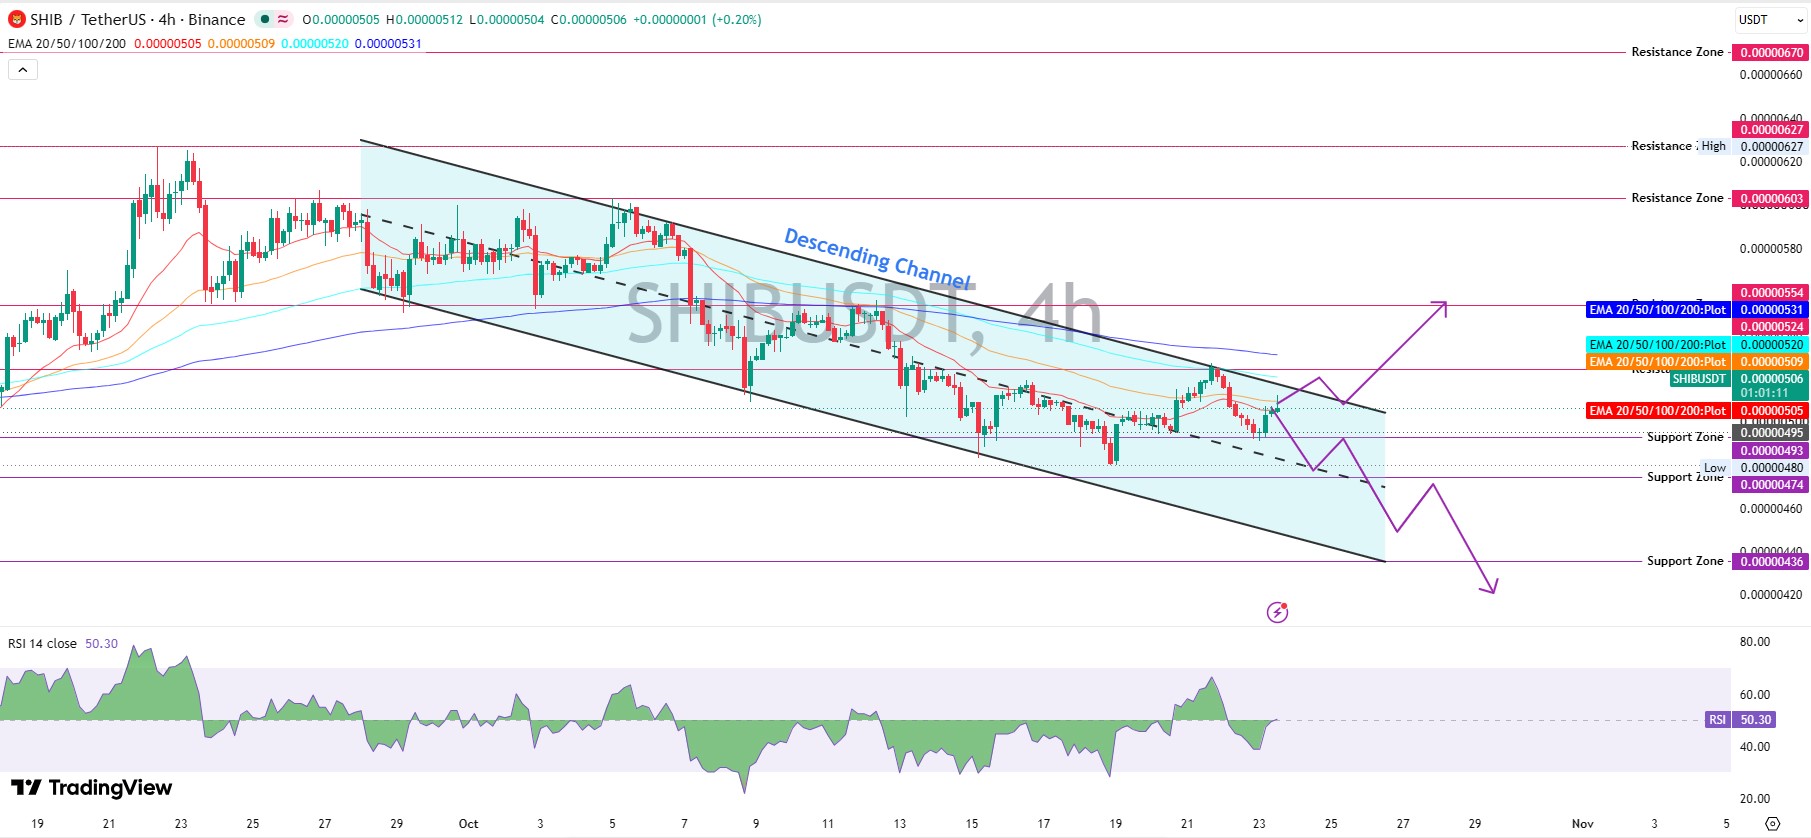
On the TradingView 4H chart, SHIB trades inside a descending channel that started in late September.
A descending channel is a pair of falling parallel lines, and each swing high lands lower than the last.
Buyers pushed the price up from $0.00000480, and for a moment it worked. Then the roof held.
A breakout feels near. Actually, scratch that, one touch of the border isn't a breakout.
$SHIB EMA Levels: A Crowded Stack
SHIB EMA means exponential moving average, a trend line that weights recent trades more. EMA 20 sits at $0.00000505 and EMA 50 at $0.00000509, almost on top of the price.
That tight pair means neither side has control.
EMA 100 at $0.00000520 and EMA 200 at $0.00000531 stack above, and that's the real wall.
Rebounds into this stack have stalled before, a pattern covered in the EMA resistance rebound piece.
SHIB RSI: Neutral at 50.30
SHIB RSI, the relative strength index, measures momentum on a 0 to 100 scale. At 50.30 it sits on the midline.
Neither buyers nor sellers seem exhausted. But neutral momentum inside a falling channel still favors the channel.
Shiba Inu Support and Resistance Levels
SHIB support and resistance levels come straight from the 4H chart.
Type | Levels |
Resistance | $0.00000524, $0.00000554, $0.00000603, $0.00000627, $0.00000670 |
Support | $0.00000495 to $0.00000493, $0.00000480, $0.00000474, $0.00000436 |
Reclaim $0.00000524 first, because without that nothing above matters. And $0.00000493 is the line bulls can't lose.
$SHIB Scenario Table
Scenario | Trigger | Target | Invalidation | Liquidity condition |
Bull | Trades and holds above $0.00000531 | $0.00000554, then $0.00000603 | Falls under $0.00000505 | Volume above $45.92M, shorts squeezed |
Base | Range between $0.00000493 and $0.00000524 | Sideways chop | Break of either edge | Volume near $45M, futures still ahead of spot |
Bear | Rejection at the roof, then break of $0.00000493 | $0.00000474, then $0.00000436 | Reclaim of $0.00000524 | Thin spot bids, longs liquidated |
Bullish Scenario: Channel Breakout
A bullish Shiba Inu forecast needs a hold above $0.00000531 with volume beyond $45.92M. Then $0.00000554 comes first, followed by $0.00000603. Thin books can run fast, and the earlier explosive chart move is proof.
Bearish Scenario: Channel Floor Risk
Bearish is the call while the price trades under $0.00000531. A rejection at the roof and a break of $0.00000493 opens $0.00000474, then $0.00000436. Macro data can speed that up, as the channel breakdown tied to CPI showed.
Shiba Inu Price Prediction for the Next 30 Days
This Shiba Inu price prediction is a range, not a promise. The base case for the next 30 days is $0.00000474 to $0.00000554, with the channel setting direction.
A push above $0.00000554 would pull $0.00000603 into play. Losing $0.00000436 would put the structure at risk. Readers comparing months can revisit the September 2026 outlook.
Long-Term Outlook: Supply and Burns
Circulating supply is 589.23T SHIB against a max of 589.55T, which leaves roughly 0.32T tokens still to circulate. A burn rate spike grabs headlines, yet 589T tokens dwarf any daily burn.
Can $SHIB reach $0.00001? That needs a gain near 97% and a market cap near $5.89B.
The price still trades 94.26% below its all-time high of $0.00008845.
What Could Change the Outlook
Three triggers matter most: Bitcoin direction, meme coin sentiment, and exchange wallet flows. A fresh ecosystem headline like the earlier Japan milestone can also shift sentiment fast.
Whale moves matter too, since thin volume can't absorb big transfers.
Final Takeaway
Bias stays cautiously bearish below $0.00000531. Neutral between $0.00000493 and $0.00000524. Bullish only after a confirmed channel break.
Readers tracking more crypto price predictions can compare setups across coins.
Disclaimer: This article is for informational purposes only and isn't financial advice. Crypto markets are volatile, so readers should do independent research before trading SHIB.

















