Mirex Network Price Prediction: Can Bulls Hold $1.22?


Can a token that slid for a month really turn into a breakout play in days?
That's the question hanging over every Mirex Network price prediction right now, with $MRX trading near $1.31 on PancakeSwap after an earlier range breakout set the stage. Buyers pushed through resistance. Sellers answered fast.
Mirex Network Data Snapshot
Figures below come from DEX Screener pair data, captured on October 23, 2026, at 04:40 UTC.
Metric | Reading |
Price | $1.31 |
24H change | +5.44% |
24H trading volume | $20K |
Liquidity | $61K |
Market cap and FDV | $35.5M |
Total supply | 27 million MRX |
Mirex Network price today sits near $1.31, and the Mirex Network market cap equals the fully diluted value (FDV, the value if every token counts). That's a small pool carrying a big number.
Why Is $MRX Price Moving Today?
Breaking: $MRX price increase today hit 5.44% in 24 hours. Price tagged $1.3690, then slipped back. Rejected. Volume stayed light at $20K.
Why is the $MRX price moving? The chart did the work, and overbought RSI levels got attention earlier.
Mirex Technical Analysis: The Chart Story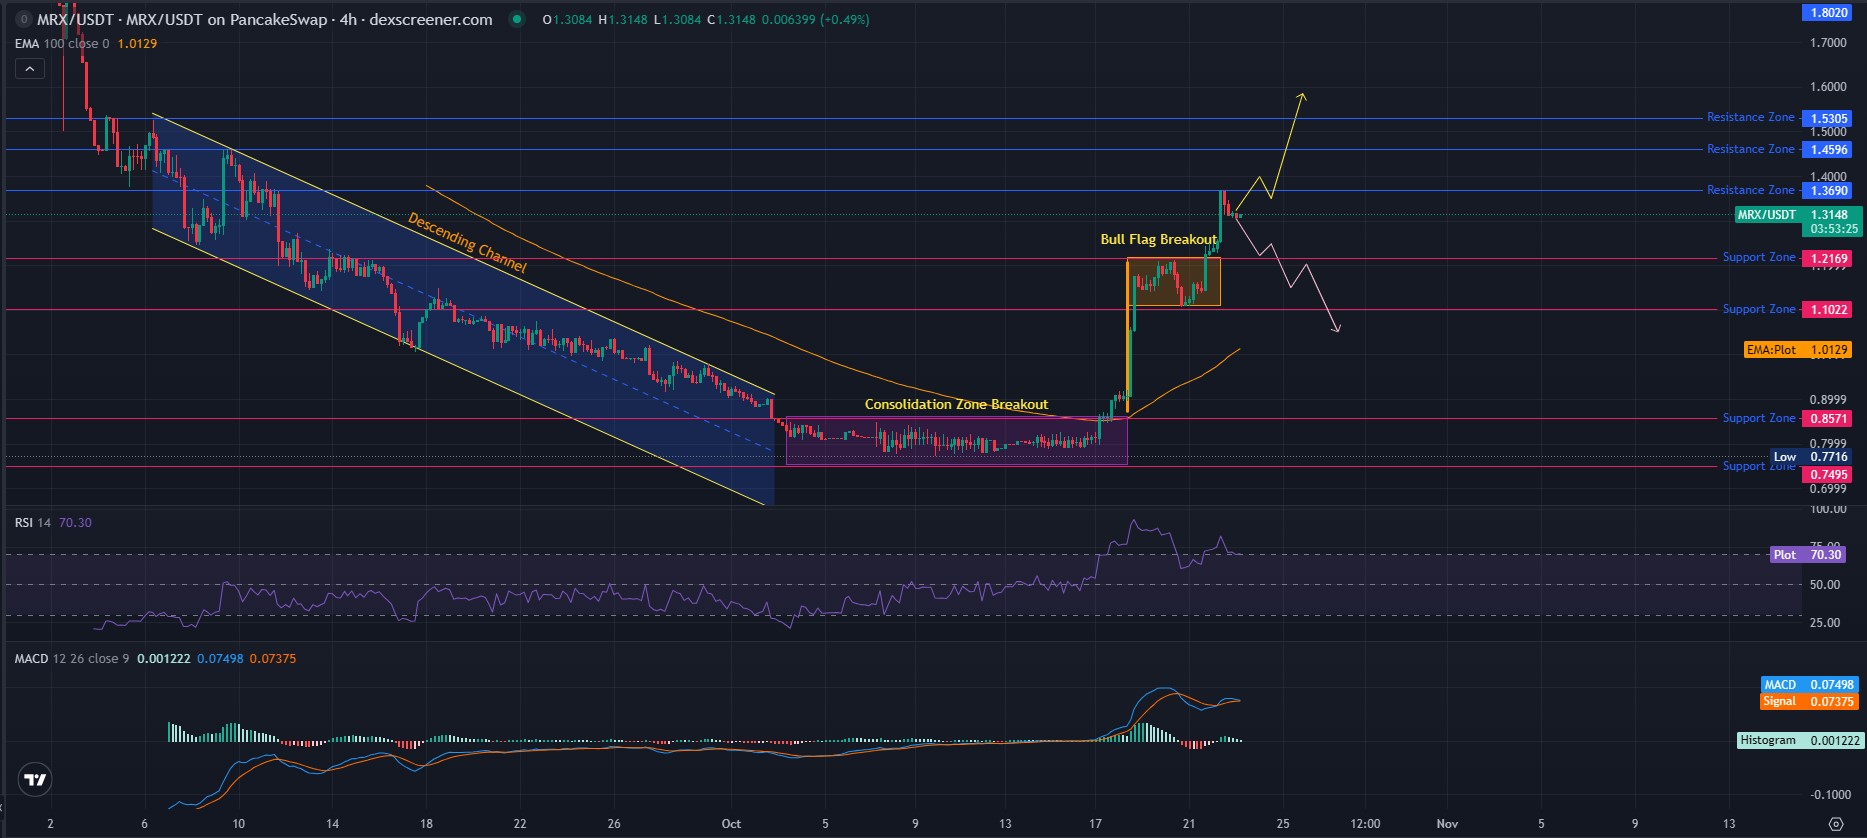
Start with the slide in this $MRX price analysis of the 4-hour chart, read at 04:40 UTC.
A descending channel, a falling lane drawn through lower highs and lower lows, ran for roughly a month. And sellers owned it.
Then momentum died. The price sat between roughly $0.77 and $0.88 for about two weeks.
Around October 17, the price blasted above the 100-period EMA. A bull flag followed, which is a small pullback after a sharp rally that often leads to another push.
That flag broke upward on October 22. Compare the setup with other price prediction pieces before trusting it.
$MRX RSI analysis starts with a simple idea. RSI measures how fast the price has moved, and 70.30 sits just inside overbought territory.
MACD tracks the gap between two moving averages. Its line at 0.07498 sits above the signal at 0.07375, which keeps momentum bullish. But the histogram reads only 0.001222. Positive, not powerful.
The 100-period EMA, short for exponential moving average, weighs recent trades more heavily. It sits at $1.0129.
Price trades about 30% above it. That's a stretched gap, and stretched gaps often pull back toward the average.
Mirex Network Support and Resistance Levels
MRX support and resistance levels come straight from the chart. Support sits at $1.2169, $1.1022, $0.8571, and $0.7495.
Resistance stacks at $1.3690, $1.4596, and $1.5305. Reclaiming $1.3690 would matter most.
Rejection at $1.3690 suggested caution. Then again, the pullback stayed shallow, and that changes the read. What matters next is one level. $1.2169.
Mirex Network Price Scenarios
Scenario | Trigger | Target | Invalidation | Liquidity condition |
Bull | Trading holds above $1.3690 on rising buy volume | $1.4596, then $1.5305 | Drop below $1.2169 | Pool depth grows beyond $61K |
Base | Range holds between $1.2169 and $1.3690 | Sideways chop | Either level breaks on volume | Pool stays near $61K, so swings stay sharp |
Bear | Breakdown below $1.2169 | $1.1022, then the EMA near $1.0129 | Reclaim of $1.2169 | Sellers meet only about $30K of USDT |
Stance: bullish above $1.2169, bearish below it.
MRX Liquidity and Trading Volume
MRX liquidity risk is the loudest warning here. The Mirex liquidity on PancakeSwap totals about $61K, split near $30K of MRX and $30K of USDT.
$MRX trading volume analysis adds to it. Just 26 traders moved $20K in a day.
A $35.5M valuation resting on that pool is fragile, a gap the liquidity rally watch article also flagged. Bigger swaps also face heavy MRX slippage and trading fees. Another danger hides in the pool.
Mirex Whale Concentration and Token Supply
MRX whale concentration deserves attention. One wallet holds 9.88% of the MRX token supply, about 2.6M tokens worth $3.4M.
So what happens if that wallet decides to sell into a pool holding $30K of USDT?
In the MRX holder distribution, 1,072 smaller addresses share 88.87% of the MRX total supply of 27 million.
Exchange Access and Listing Watch
Mirex Network PancakeSwap trading is the only venue in the data reviewed. No centralized exchange appears in it.
How to buy Mirex Network starts with verifying the official contract address.
Any major listing would shift liquidity quickly. Details sit in Mirex Network listing date coverage.
Can MRX Reach $5? Mirex Network Price Prediction 2026
At 27 million tokens, an Mirex price target of $5 means a $135M valuation, roughly 3.8 times today's $35.5M.
Can the Mirex price go up first? Yes, if $1.3690 breaks on volume. A breakout needs fuel. Volume, mostly.
The Mirex Network price prediction 2026 map starts with $1.4596 and $1.5305, the only chart levels above. Anything higher needs deeper liquidity and a real catalyst, such as Binance listing price talk. No listing is confirmed.
Mirex Network Fundamentals
The official Mirex website describes MRX as a utility token for gas fees and smart-contract execution, with 27 million tokens in total.
It also highlights Mirex Network RWA tokenization, meaning real-world assets represented on-chain, alongside the Mirex Network and Lumira ecosystem.
Mirex token utility only drives demand once real usage shows up. But the MRX-20 blockchain, the Mirex Network roadmap and Mirex Network adoption all need proof first.
Risks That Could Change the Outlook
Mirex Network risks stack up. Thin liquidity, concentrated wallets, an overbought RSI, and no verified catalyst.
Why is the Mirex price falling? Would it become the question if $1.2169 breaks? And Mirex token trading risks rise with every thin-volume day.
Is Mirex Network a good investment? No chart can answer that. Milestones on a coin events calendar help track real catalysts.
Final Takeaway
Mirex Network price prediction leans bullish above $1.2169 and cautious below it. The breakout is real. But the pool is tiny. And the biggest wallet sits at the center of it.
Disclaimer: This article is for information only and isn't financial advice. Crypto prices swing hard, especially in low-liquidity tokens. Always research independently and never risk money that can't be lost.

















