Pi Network: Pi Coin Eyes a Breakout as Protocol 28 Goes Live


Pi Network just locked in its upgrade dates. Yet PI slipped 0.8% in a day.
That mismatch drives this Pi Network price prediction, which arrives right after the Protocol 27 upgrade reached Mainnet.
Launched in 2019 as a mobile-first crypto project, Pi Network went live on Mainnet on February 20, 2025, after years of testing.
Pi Network price today sits at $0.08848, giving Pi Network market cap (total value of circulating coins) of $995.045M as of Sep 29, 2026, 04:55 UTC.
That's roughly 97% below the February 2025 peak near $3. Recovery remains a steep climb.
Pi Network Price Today: Live Market Data
| Metric | Value |
| Price | $0.08848 |
| 24h Change | -0.8% |
| 24h Range | $0.08773 to $0.08989 |
| Market Cap | $995.045M |
Source: market data taken from CoinGecko, as of Sep 29, 2026. Figures may vary slightly across other tracking websites.
Price sits in the lower half of the 24-hour range. Trading volume, the value of PI changing hands in a day, reached just $6.586M, about 0.66% of market cap.
Basically, liquidity is light, so sharp swings can arrive fast.
Fully diluted valuation , market value counting the total supply, sits at $1.531B, about 54% above market cap. Turns out, only 11.243B of 17.297B PI circulates.
Pi Network News: Protocol 28 Sets Two Key Dates
Breaking: Pi Network news just landed. The testnet now runs Protocol 28.
BSCN reports the Pi Core Team upgraded the testnet, the practice version of the network, after finishing the Protocol 27 Mainnet upgrade.
Source: Data Taken From @BSCNews , X Account, as of Sep 29, 2026
Node operators (servers keeping the network alive) must upgrade by October 13.
Mainnet follows on October 16. Protocol 28 targets delays in transaction data and lets developers upgrade smart contracts and self-running code in groups.
Noted. But upgrade news doesn't move price alone. Buyers still need to show up on the chart.
Pi Network Technical Analysis: Descending Channel on the Hourly Chart
When we pulled up the hourly chart, one shape stood out. PI trades inside a descending channel, with two falling parallel lines forming a ceiling and a floor.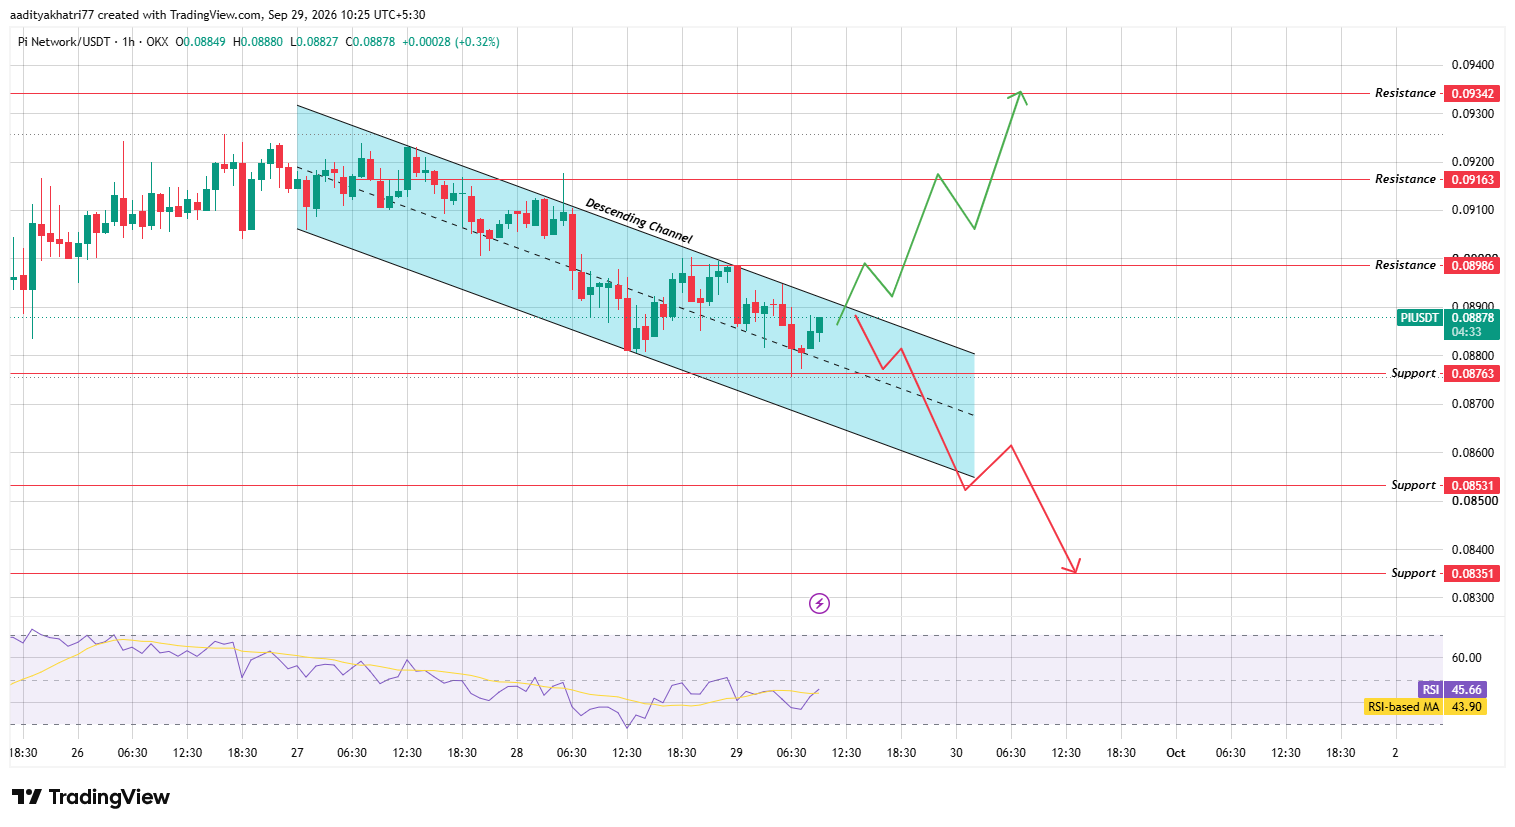
Source: Chart taken from TradingView , as of Sep 29, 2026
This Pi Network technical analysis rests on a channel that's guided price lower for about two days.
Price trades at $0.08878 on OKX, just above the channel's midline.
Support, a level where buyers have stepped in before, sits at $0.08763. Resistance, where sellers tend to appear, waits at $0.08986.
Here's the thing: descending channels favor sellers until the upper boundary breaks. Bias stays bearish for now.
The next move hinges on one level: $0.08986.
Pi Network RSI: Momentum Is Recovering
The Relative Strength Index (RSI) scores momentum from 0 to 100. Above 70 flags overheated buying, and below 30 flags heavy selling.
When we checked the hourly RSI, it read 45.66.
Its moving average, a smoothed average of recent readings, sits lower at 43.90.
The price seems weak at first glance. Actually, scratch that: RSI has climbed above its average, so a bounce attempt is underway.
Turns out, RSI still sits under the neutral 50 line. But improving isn't the same as strong.
Can Pi Coin Break Above the Channel and Resistance?
A push above the upper boundary would put the Pi coin on a recovery path. Resistance then waits at $0.08986, about 1.2% above current trades. Bulls need two things. Volume and a hold above $0.08986.
Confirmation means an hourly candle that trades and holds above both, with hourly volume above the roughly $274K average implied by the $6.586M daily figure.
Next comes $0.09163, about 3.2% higher, then $0.09342, near 5.2% above.But a breakout without volume proves little.
What Happens If Pi Network Gets Rejected?
So what if the price reaches the upper boundary and simply stalls?
Sellers need one thing first. A rejection there, then an hourly candle trading below $0.08763, would confirm the downtrend. Fast.
Then $0.08531 comes first, about 3.9% below current trades.
And $0.08351 waits below that, roughly 5.9% lower. Pressure builds fast on thin volume.
Pi Network Price Levels: Support and Resistance
| Support | Resistance |
| $0.08763 | $0.08986 |
| $0.08531 | $0.09163 |
| $0.08351 | $0.09342 |
These Pi Network price levels come from the hourly chart.
Pi Network Price Prediction October 2026: Scenarios
| Scenario | Setup | Level |
| Bull | Breakout above the upper boundary and $0.08986 | $0.09163 to $0.09342 |
| Base | Range inside the channel | $0.08763 to $0.08986 |
| Bear | Rejection, then break of $0.08763 | $0.08531, then $0.08351 |
For the Pi Network price prediction October 2026, the base case is a range between $0.08763 and $0.08986.
The wider Pi Network price prediction 2026 stays cautious below $0.08986.
PI vs Bitcoin
Pi Network lost 0.4% against Bitcoin in 24 hours, so it lagged the market leader slightly. and altcoins tend to follow Bitcoin's mood.
Disclaimer: This article isn't financial advice. PI is highly volatile, and a break below $0.08763 could push losses toward $0.08351. No outcome is guaranteed.



.webp)













